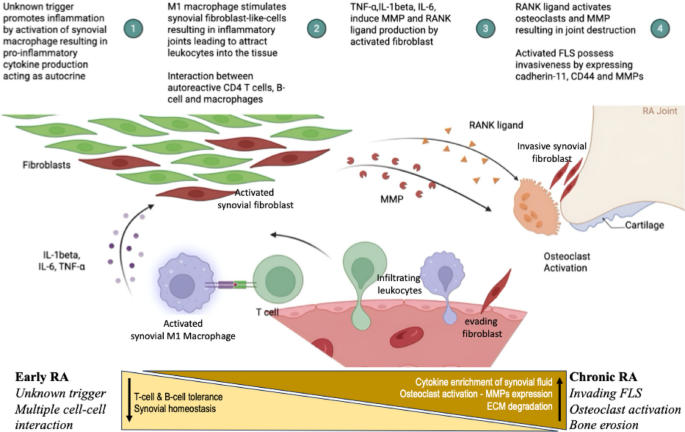
Polarization and characterization of inflammatory macrophages (M1) from THP-1 cells
THP–1 cell growing in suspension were differentiated into adherent resting macrophages (M0) after 24 h of PMA stimulation. Both THP-1 and M0 macrophages exhibited a round and smooth cell surface with an average diameter of 8.55 ± 0.21 mm2 and 32.05 ± 1.48 μm respectively (Supportive Fig. 1B & C). The morphological characteristics of inflammatory macrophages (M1) became evident following LPS stimulation of resting (M0) macrophages for 48 h. Scanning electron micrographs (SEM) revealed that inflammatory macrophage (M1) displayed an amoeboid morphology with numerous spike–like cytoplasmic projections extending from their surface23 and had a diameter of 50.70 ± 2.9 μm (Supplementary Fig. 1D). The differentiation into macrophages was further confirmed by the expression of the characteristic marker CD68 following LPS stimulation (Supplementary Fig. 1F-I). A significantly higher expression of CD44 was observed in the M1 macrophage lineage, aiding in cell-cell communication similar to that seen in native RA conditions. This further confirmed the inflammatory phenotype of M1 macrophages (Fig. 3A-D).
(A–C) Representative CLSM images showing CD44 expression (green) in THP-1 cells, M0 macrophages, and M1 macrophages, nuclei were counter stained with DAPI (blue). Scale bar: 20 μm; (D) Quantitative analysis of CD44 expression in THP-1 cells, M0 macrophages and M1 macrophages using image J software (One way ANOVA, *p < 0.05).
Gene and protein expression of macrophage lineage
Synovial macrophages contribute to the maintenance of tissue homeostasis, while infiltrating monocyte–derived inflammatory macrophages play a crucial role in upregulating pro–inflammatory cytokines. These cytokines, in turn, stimulate synovial cells to overexpress matrix metalloproteinases (MMPs), which contribute to bone erosion through the degradation of collagen and proteoglycans24. To assess the inflammatory profile, the gene expression of key cytokines was evaluated using qRT–PCR. Inflammatory macrophages (M1) exhibited significantly elevated expression levels of TNF–α (3.97 ± 0.16-fold) and IL–1β (149.18 ± 3.59-fold) compared to THP-1 cells and resting M0 macrophages (*p < 0.05) (Fig. 4A & B). Corresponding protein levels, measured by ELISA, also showed significantly increased expression of TNF–α (163.84 ± 12.58 pg/mL), IL–1β (85.72 ± 0.35 pg/mL) in M1 macrophages, aligning with qRT–PCR data (Fig. 4C & D). Further, qRT-PCR analysis of MMP gene expression revealed a significant upregulation of MMP2 (1.2 ± 0.17-fold), MMP3 (359.81 ± 27.98-fold) and MMP9 (127.93 ± 3.39-fold) in M1 macrophages compared to THP-1 and M0 macrophages (Fig. 4E–G). Additionally, a marked increase in the expression of CD44 (51.57 ± 2.49-fold), was observed in M1 macrophages (Fig. 4H), reinforcing its relevance as a key regulator of cell–cell, cell–matrix communications as well as cell migration – hallmarks of RA pathogenesis.
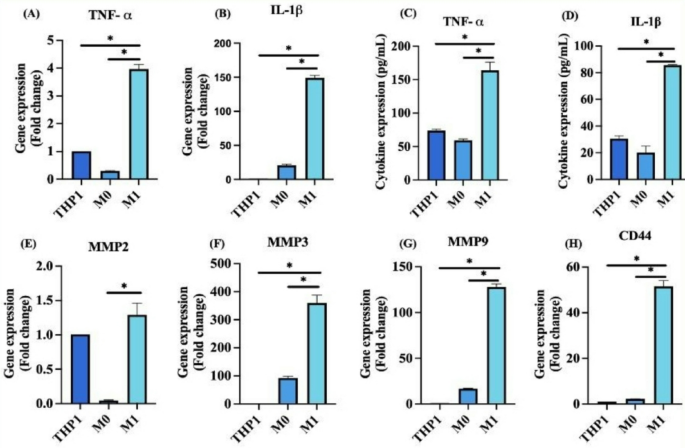
(A, B) Gene expression levels of inflammatory cytokines TNF–α and IL–1β respectively, in THP-1, M0 and M1 macrophages, analyzed by qRT–PCR; (C, D) Quantification of TNF–α and IL–1β protein expression in resting and stimulated cells using ELISA; (E–G) Gene expression analysis of matrix metalloproteinase MMP2, MMP3, and MMP9 in THP-1, M0 and M1 macrophages; (H) Gene expression of CD44 in THP-1, M0 and M1 macrophage cells. (n = 3; One way ANOVA, *p < 0.05).
Development and characterization of stimulated rat fibroblast–like–Synoviocytes
Primary fibroblast–like–Synoviocytes (rFLS) was isolated from rat synovial tissue and stimulated for 48 h using concentrated cytokine-enriched conditioned media. The morphology and expression of RA specific biomarkers including fibroblast-specific protein (FSP), cadherin–11 (cad–11) and CD44 were analyzed before and after stimulation using scanning electron microscopy and laser confocal microscopy. SEM imaging revealed that the isolated rat FLS displayed a typical fibroblast morphology under resting conditions, whereas stimulation with cytokine-enriched conditioned media induced a pronounced elongated, spindle-shaped morphology (Fig. 5A & B). Live cell imaging demonstrated the dynamic phenotypic transformation of rFLS from a resting to an activated state upon exposure to the cytokine-rich media (Supplementary video 1 & 2). Immunofluorescence analysis confirmed the expression of fibroblast-specific markers – fibroblast specific protein (FSP) and cadherin–11 (cad–11) and CD44 in the isolated FLS, indicating their synovial fibroblast-like characteristics (Fig. 5C – E). Following 48 h of stimulation, there was notable upregulation in the expression levels of these markers (Fig. 5F – H). Notably, Cad–11 and CD44 are key mediators of cell migration and invasion, critical to the pathogenic role of activated fibroblast–like–cells in the RA synovium25,26. Quantitative morphological analysis revealed a significantly increased aspect ratio in stimulated rFLS cells (14.22 ± 0.88) compared to non–stimulated cells (2.44 ± 0.17), reflecting the morphological polarization associated with an activated state (Fig. 5I). Additionally, quantitative analysis of immunofluorescence-stained cells confirmed increased expression of FSP, cadherin–11 and CD44 following cytokine stimulation (Fig. 5J – L).
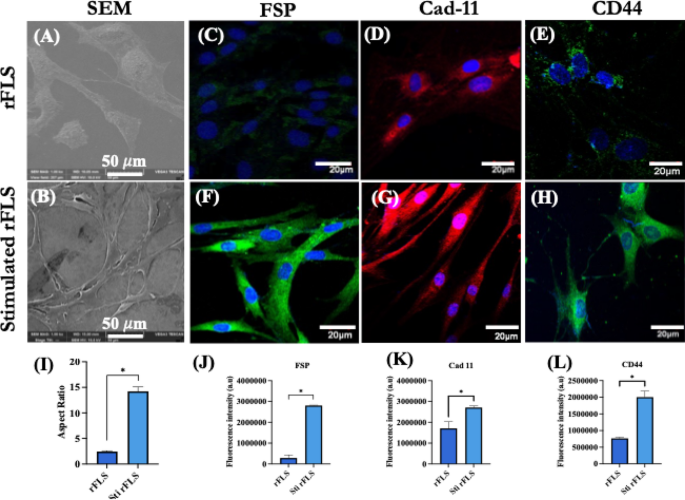
(A, B) Representative SEM images of resting and stimulated synovial fibroblast-like cells from rat, respectively; (C–E) CLSM images of showing immunofluorescence staining of fibroblast specific protein (FSP), cadherin–11 (Cad–11) and CD44 of non–stimulated rFLS (Scale bar: 20 μm); (F–H) CLSM images of fibroblast specific protein (FSP), cadherin–11 (Cad–11) and CD44 of stimulated rFLS (Scale bar: 20 μm); (I) Quantification of the aspect ratio of non–stimulated and stimulated rFLS, indicating morphological polarization; (J–L) Quantitative fluorescence intensity analysis of fibroblast specific protein, cadherin-11 and CD44 in non–stimulated and stimulated rFLS (Student’s t–test, *p < 0.05).
Gene and protein expression of stimulated rat fibroblast–like– synoviocytes
The expression of marker genes such as Thy–1 (CD90) (1.37 ± 0.10-fold) and cadherin–11 (5.79 ± 0.30-fold), which are typically expressed by synovial fibroblast and are involved in maintaining synovial lining integrity, confirmed the fibroblast characteristic of the isolated rFLS from rat synovium (Fig. 6A & B). Upon stimulation with cytokine-enriched conditioned media for 48 h, the rFLS exhibited an upregulation in inflammatory cytokine gene expression including TNF–α (1.57 ± 0.007-fold), IL–1β (6.30 ± 0.17-fold) and IL–6 (4.94 ± 0.12-fold) compared to non–stimulated cells (Fig. 6C – E). ELISA quantification revealed significantly elevated secretion levels of these cytokines in stimulated FLS: TNF–α (558.29 ± 37.05 pg/mL), IL–1β (98.11 ± 0.66 pg/mL) and IL–6 (10096.64 ± 256.39 pg/mL) (Fig. 6F – H). The cytokines detected in the conditioned media (Fig. 6I) served as potent stimulants, triggering cytokine production in FLS. These secreted inflammatory mediators are known to induce CD44 and matrix metalloproteinase production27contributing to extracellular matrix remodeling and bone erosion. CD44 expression (1.79 ± 0.06-fold) was significantly increased, supporting enhanced cell–cell communication, cell–matrix interaction, migration and invasion. Additionally, the expression of MMP2 (2.05 ± 0.05-fold) and MMP9 (37.61 ± 0.89-fold) was significantly higher in stimulated FLS (Fig. 6J – L), consistent with their role in ECM-degradation and RA-associated joint destruction.
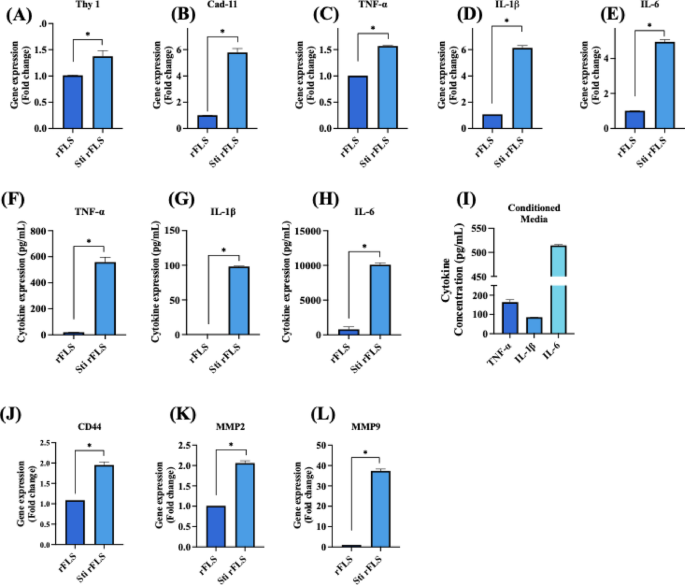
Gene and protein expression profiles of non–stimulated and cytokine-stimulated rFLS cells. (A, B) Gene expression of synovial fibroblast markers Thy–1 and cadherin–11; (C–E) Gene expression of proinflammatory cytokines TNF–α, IL–1β and IL–6; (F–H) ELISA-based quantification of TNF–α, IL–1β and IL–6 secretion in non-stimulated vs. stimulated rFLS cells and (I) Cytokine concentrations in the macrophage-derived conditioned media used for FLS stimulation; (J–L) Gene expression of CD44, MMP2 and MMP9, in non-stimulated vs. stimulated rFLS cells (n = 3; Student’s t–test, *p < 0.05).
Migration and invasion potential of stimulated rFLS
As discussed earlier, the expression of various factors such as cadherin-11, CD44 and MMPs aids cellular migration and invasion. Therefore, the migratory and invasive characteristics of stimulated rFLS cells were evaluated. After 48 h of stimulation with cytokine-enriched conditioned media, rFLS demonstrated approximately 60% wound closure, indicating a significantly enhanced migration compared to non–stimulated control cells (Fig. 7A). Additionally, transwell invasion assays revealed that stimulated rFLS had greater invasive potential through ECM–mimetic Matrigel® toward a cytokine-enriched conditioned media with fresh media, compared to the non–stimulated group (Fig. 7C & D). This increased invasiveness is attributed to the cytokine-induced upregulation of MMP expression, mimicking inflammatory conditions observed in RA.
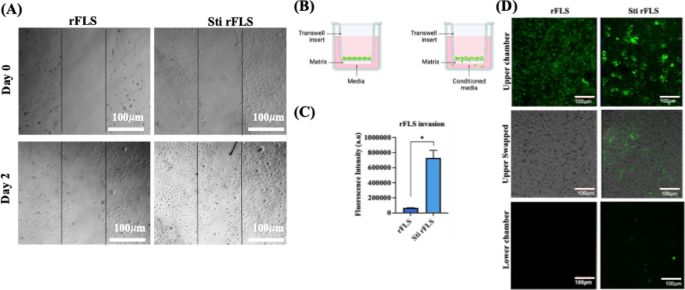
(A) Time dependent wound closure analysis of non–stimulated and stimulated rFLS cells, (Scale bar: 100 μm); (B) Schematic representation of the transwell setup for the cell invasion assay; (C, D) Quantification of fluorescence intensity and representative CLSM images showing green-labelled rFLS invading through Matrigel® under cytokine-stimulated conditions (Scale bar: 100 μm). (n = 3; Student’s t–test, *p < 0.05).
Development and characterization of stimulated SW982 cells
Similarly, the human synovial sarcoma cell line SW982 was stimulated with inflammatory cytokine-enriched conditioned media for 48 h to mimic RA–FLS conditions28,29. Scanning electron microscopy revealed a spindle-shaped morphology in stimulated SW982 cells, with a significantly higher mean aspect ratio (3.95 ± 0.22) compared to non–stimulated cells (1.70 ± 0.04) (Fig. 8A, B & I). Both non–stimulated and stimulated SW982 cells were immunostained for fibroblast–specific protein (FSP), cadherin–11 (Cad–11) and CD44 key markers involved in cell migration, adhesion and tissue remodeling in RA synovium. Immunofluorescence images (Fig. 8C – E) confirmed that SW982 cells exhibited fibroblast-like synoviocytes (FLS) characteristics with significantly higher expression of these markers in the stimulated group (Fig. 8F – H). In RA pathology, CD44 drives cell migration and invasion by regulating MMPs activity and cytoskeletal dynamics30,31while cadherin–11 promotes tight cell clustering within inflamed and hyperplastic synovial tissue26,32,33. The elevated expression of FSP, CD44, and cadherin–11 in stimulated SW982 cells supports their use as an in vitro model resembling the hyperactive, migratory and invasive phenotype of RA-FLS (Fig. 8J – L).
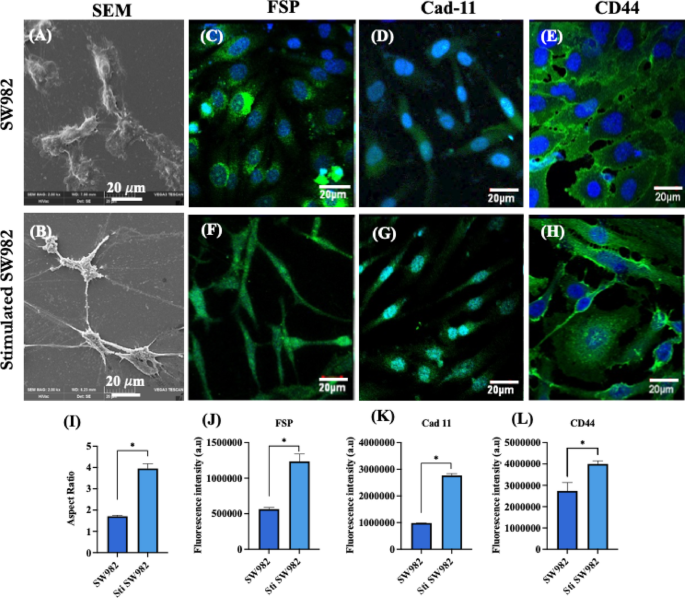
(A, B) Representative SEM images of non-stimulated and stimulated SW982 cells; (C–E) Representative CLSM images showing immunofluorescence staining for fibroblast specific protein (FSP: green), cadherin–11 (Cad–11: green) and CD44 (green) in non-stimulated SW982 cells (F–H) Corresponding images for stimulated SW982 cells. All cells were counterstained with DAPI for nuclei visualization (blue) (Scale bar: 20 μm); (I) Quantification of the aspect ratio of non-stimulated and stimulated SW982 cells; (J–L) Quantitative fluorescence intensity analysis of FSP, Cad-11 and CD44 in non-stimulated and stimulated SW982 cells (n = 3; Student’s t–test, *p < 0.05).
Gene and protein expression of inflammatory SW982 cells
The inflammatory response of SW982 cells was further evaluated by assessing the gene and protein expression of key functional markers and inflammatory cytokines following stimulation with cytokine-enriched conditioned media. After 48 h of stimulation, the expression levels of pro–inflammatory cytokines (TNF–α and IL–1β), matrix-remodeling enzymes (MMPs: MMP2, MMP3, MMP7 and MMP9) and fibroblast–specific markers (Cadherin–11 and CD44) were evaluated. Quantitative PCR analysis revealed significant upregulation of cadherin–11 (7.08 ± 0.36-fold), CD44 (2.45 ± 0.14-fold) and pro-inflammatory cytokines such as TNF–α (1.726 ± 0.02-fold) and IL–1β (1.82 ± 0.16-fold) in stimulated SW982 cells compared to non–stimulated controls (Fig. 9A – D). These findings were corroborated by ELISA, which confirmed significantly elevated secretion of TNF–α (153.49 ± 6.04 pg/mL) and IL–1β (275.08 ± 32.15 pg/mL) by the stimulated cells (p < 0.05) (Fig. 9E & F). These results indicate that the cytokine-enriched conditioned media effectively induces a pro–inflammatory phenotype in SW982 cells, closely mimicking the cytokine expression profile of rheumatoid arthritis synovial fibroblasts. Further invasion potential of SW982 cells was evaluated through the expression of MMP2, MMP3, MMP7 and MMP9. qRT-PCR results showed a significant increase in MMP2 (1.86 ± 0.29-fold), MMP3 (1.85 ± 0.08-fold), MMP7 (12.62 ± 2.20-fold) and MMP9 (25.0 ± 0.30-fold) expressions in stimulated SW982 cells (Fig. 9G – J). These data confirm that cytokine stimulation successfully promotes an inflammatory phenotype characterized by enhanced matrix degradation activity. The significant upregulation of TNF–α and IL–1β indicates a robust pro–inflammatory response consistent with the cytokine milieu observed in RA joints. These cytokines are key mediators of synovial inflammation and fibroblast activation, contributing to joint destruction and synovial hyperplasia. Notably, elevated TNF–α levels are critical drivers of RA pathogenesis and are major therapeutic targets. Moreover, the upregulation of MMP2 and MMP9 expression highlights the enhanced invasive potential of stimulated SW982 cells. MMPs are crucial mediators of ECM degradation and are directly associated with cartilage and bone erosion in RA. Collectively, these findings suggest that cytokine-enriched conditioned media effectively mimics the inflammatory microenvironment of RA, driving both cytokine production and ECM-degrading enzyme expression in SW982 cells34.
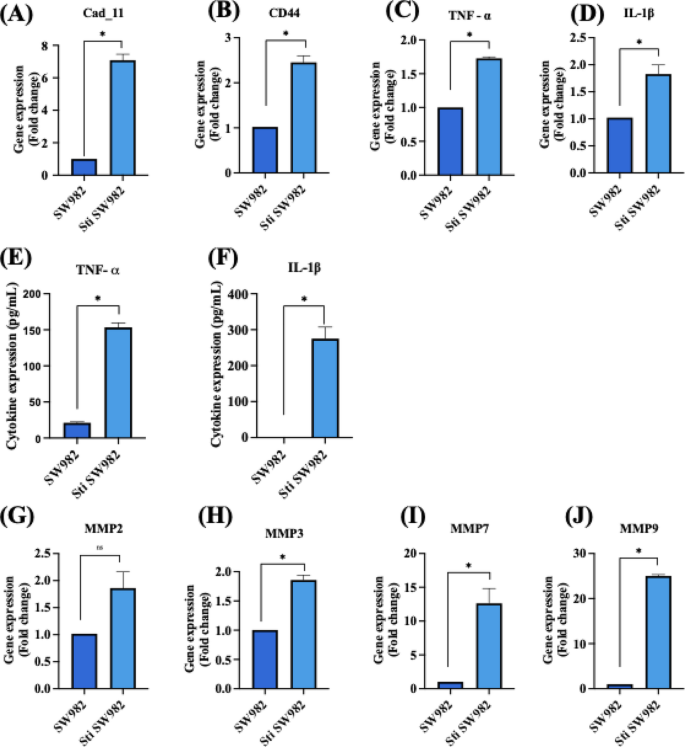
Gene and protein expression analysis of non–stimulated and stimulated SW982 cells. qRT–PCR analysis of (A) cadherin–11, (B) CD44, (C) TNF–α, (D) IL–1β. ELISA quantification of inflammatory cytokine secretion levels of (E) TNF–α and (F) IL–1β. qRT–PCR analysis of matrix metalloproteinases (G) MMP2, (H) MMP3, (I) MMP 7 and (J) MMP 9. (n = 3; Student’s t–test, *p < 0.05).
Migration and invasion potential of stimulated SW982
The migratory and invasive behavior of stimulated SW982 cells following stimulation with cytokine-enriched conditioned media was evaluated using wound closure and Transwell invasion assays, as RA–FLS are known to contribute to ECM degradation and joint destruction through their aggressive migratory phenotype and invasive characteristics35,36. After 48 h of stimulation, SW982 cells demonstrated a marked closure, with approximately 80% of closure observed, compared to minimal closure in non–stimulated group (Fig. 10A). The Transwell assay setup is schematically represented in Fig. 10B. Invasion assays revealed that stimulated SW982 cells were capable of penetrating the ECM mimetic Matrigel® and migrating toward the chemoattractant present in the lower chamber. This was in sharp contrast to non–stimulated cells, which showed negligible invasion (Fig. 10C & D). The enhanced invasion of the stimulated SW982 cells is attributed to the cytokine-mediated upregulation of matrix metalloproteinases (MMPs), as demonstrated earlier by elevated MMP2, MMP3, MMP7, and MMP9 gene expression levels. The results highlight that cytokine-enriched conditioned media effectively induce an aggressive phenotype in SW982 cells, mimicking native RA-FLS behavior in promoting cartilage and bone damage through ECM degradation and tissue invasion.
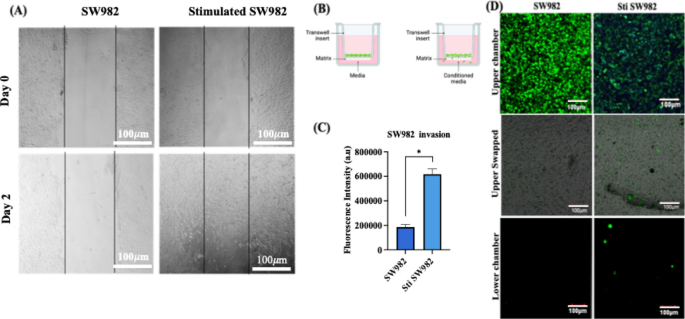
(A) Wound closure assay illustrating the migration potential of stimulated Vs non–stimulated SW982 cells. (Scale bar: 100 μm); (B) Schematic representation of the Transwell invasion assay setup; (C) Quantification of fluorescence intensity of green-labelled SW982 cells that invaded the Matrigel® matrix toward chemoattractant in the lower chamber and (D) Representative CLSM images showing invasive SW982 cells under stimulated and non-stimulated conditions. (Scale bar: 100 μm) (n = 3; Student’s t–test, *p < 0.05).
Hypoxia-inducible factor 1α (HIF-1α) expression in activated synovial cells
Hypoxia-inducible factor 1 alpha (HIF-1α) exhibits distinct and pathologically relevant expression patterns within the synovial tissue of rheumatoid arthritis patients, playing a central role in disease progression and in sustaining the inflammatory microenvironment. Upon activation of M1 macrophages, SW982 and rFLS cells (Fig. 11A – D), HIF-1α expression demonstrated an increase in fluorescence intensity, consistent with the pro-inflammatory phenotype and its reliance on cytokine production37. In particular, the upregulation of HIF-1α in fibroblast-like synoviocytes (FLS), enhances the production of inflammatory cytokines and surface receptors involved in cell-cell interactions38. The chronic hypoxic conditions characteristic of RA joints contributes to sustained HIF-1α expression throughout the synovial membrane, thereby perpetuating the inflammatory response that defines RA pathophysiology39. The observations in stimulated rat fibroblast-like cells closely mirror those seen in the human SW982 cell line, further supporting the translational relevance of these findings. The upregulation of HIF-1α is indicative of hypoxic stress, which is known to drive synoviocytes proliferation and subsequent activation – key processes in RA progression40.
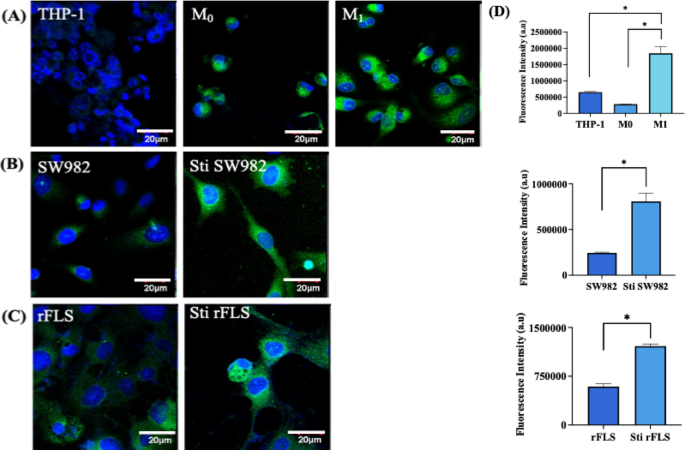
Immunofluorescence analysis of hypoxia inducing factor–alpha (HIF-1α) expression in various cell types; (A) THP–1 monocytic cells, resting macrophage (M0) and activated macrophages (M1); (B) Human synovial sarcoma cell line SW982 and its stimulated counterpart; (C) Rat fibroblast–like–synoviocytes and stimulated rFLS. Cells were stained for HIF-1α (green) and counterstained with DAPI for nuclei (blue). Scale bar: 20 μm; (D) Quantification of HIF–1α fluorescence intensity across cell groups (n = 3). (Student’s t–test & one-way ANOVA, *p < 0.05).
Development of RA co-cultured in vitro model
In this study, an in vitro model of rheumatoid arthritis was established by co-culturing rat-derived fibroblast–like synoviocytes (rFLS) or SW982 cells with either M0 or M1 (pro-inflammatory) polarized macrophages. This model was designed to replicate the inflammatory microenvironment of RA joints, where macrophages are known to mediate the activation of resting synovial FLS. It serves as a valuable tool for investigating RA pathogenesis and evaluating potential therapeutic interventions. ROS levels were measured using DCFDA assays. The results demonstrated significantly elevated ROS production (Fig. 12A & B) in rFLS–M1 co–cultures (1:2 ratio) compared to rFLS–M0 co–cultures after 3 days (p < 0.05). This elevated ROS level suggests that M1 macrophages induce an oxidative stress environment, contributing to the pathological conditions observed.
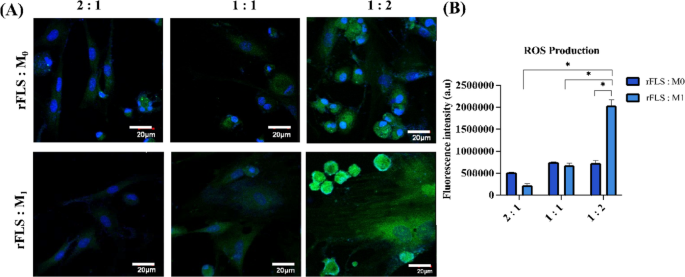
Co-culture of synovial FLS and macrophage lineage cells; (A) CLSM images representing ROS production in FLS co-cultured with either M0 or M1 macrophages at varying ratios (FLS: macrophage = 2:1, 1:1 or 1:2) on day 3; ROS is visualized in green (DCFDA), and nuclei are counterstained with DAPI (blue). Scale bar = 20 μm. (B) Quantitative analysis of ROS fluorescence intensity from CLSM images (n = 3; Two-way ANOVA, *p < 0.05).
Morphological changes in rFLS co-cultured with macrophages
Time–lapse imaging of the rFLS–M1 macrophage co–culture model further confirmed early cell–cell interactions on day 1, followed by the appearance of elongated spindled-shaped rFLS and clustered macrophages by day 3 (Fig. 13A). This phenomenon were not observed in the rFLS– M0 macrophage co–culture model. Scanning electron microscopy and optical micrographs revealed that rFLS co-cultured with M1 macrophages developed an aggressive phenotype, characterized by increased spindle–shaped extensions and clustering of M1 macrophages (Fig. 13B & C). These features were absent in rFLS co-cultured with non-stimulated (M0) macrophages. In RA patients, the clustering of inflammatory macrophages within the synovial lining has been reported, and the clusters are often associated with various cell populations at different stages of disease progression3,41.
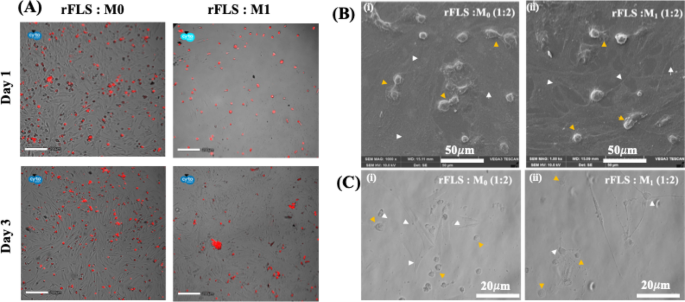
(A) Fluorescence images representing the distribution of red-stained M0 or M1 macrophages co-cultured with rFLS at different time points (Scale bar: 200 μm); (B, C) SEM and optical micrographs representing the co-culture of FLS with either resting (M0) or inflammatory (M1) macrophages (yellow arrowheads: M0 or M1 macrophages; white arrowheads: rFLS cells). Scale bars: 20 μm (optical) and 50 μm (SEM).
Time–lapse videos of the rFLS–M0 and rFLS–M1 macrophage co-culture models further support these observations, showing specific interactions in the rFLS–M1 macrophage co–culture as early as day 1 (Supplementary Videos 3 & 4). The videos capture the cross-talk between cells, indicated by the transfer of the red tracker dye from M1 macrophage to non-labelled rFLS cells. This interaction confirms active cellular communication, which initially induced a morphological transition of rFLS from a spindle shape to a rounded form, followed by a reversion to an elongated spindle shape by day 3 (Fig. 13C). These morphological changes confirm successful cell-cell interactions. Overall, this in vitro RA model, incorporating both rFLS and macrophages, closely resembles the oxidative and inflammatory microenvironment characteristic of RA joints. It offers a robust platform for studying RA pathogenesis, including signaling pathways and cellular mechanisms.
Invasion potential of RA co-cultured in vitro model
Transwell and Matrigel® invasion assays demonstrated a significantly higher invasive capacity in the rFLS–M1 co–culture model compared to the rFLS–M0 model (p < 0.05), likely driven by the inflammatory and oxidative stress induced by M1 macrophages. This finding is consistent with in vivo characteristics of RA Synoviocytes, where elevated ROS levels and pro–inflammatory cytokines contribute to synovial hyperplasia and cartilage invasion31,33. For the assay, red–labelled resting (M0) or activated (M1) macrophages were seeded in the lower chamber, while green-labelled rFLS were seeded onto Matrigel®–coated Transwell inserts and cultured for 24 h. Figure 14A & B illustrate the coexistence of green–labelled rFLS and red–labelled M1 macrophages in the lower chamber, confirming that rFLS successfully invaded through the Matrigel® matrix (Fig. 14B iii). In contrast, no green–labelled rFLS were detected in the lower chamber when it contained resting M0 macrophage (Fig. 14B ii), highlighting the role of activated M1 macrophages in promoting rFLS invasion.
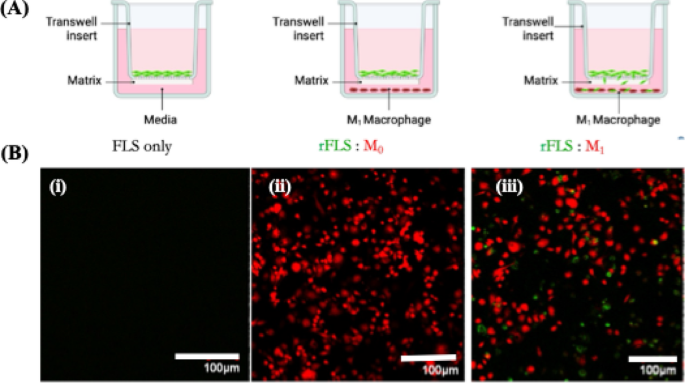
Invasion assay of rFLS in the RA co-culture model (A) Schematic representation of the Trans–well co-culture setup; (B) Confocal laser scanning microscopy images showing invasion of green-labelled rFLS toward red-labelled inflammatory (M1) macrophages (Scale bar 100 μm).
In further experiments, green–labelled rFLS or SW982 cells were co-cultured with or without M1 macrophages, to validate these findings (Fig. 15 Ai & ii). The presence of rFLS in both the upper (after swapping) and lower chambers in the presence of M1 macrophages further demonstrated the ability of inflammatory M1 macrophages to promote rFLS invasiveness. The invasion of synovial fibroblast–like cells was significantly higher (p < 0.05) in the presence of M1 macrophages compared to non–stimulated controls (Fig. 15 Bi & ii). These results suggest that inflammatory cytokine secreted by M1 macrophages (discussed elsewhere) activate synovial fibroblast–like cells (rFLS and SW982), leading to the expression of key cell–cell interaction motifs, including CD44, Cad–11 and MMPs as reported in other sections of this study. These factors collectively contribute to the enhanced invasive behavior of activated FLS toward M1 macrophages.
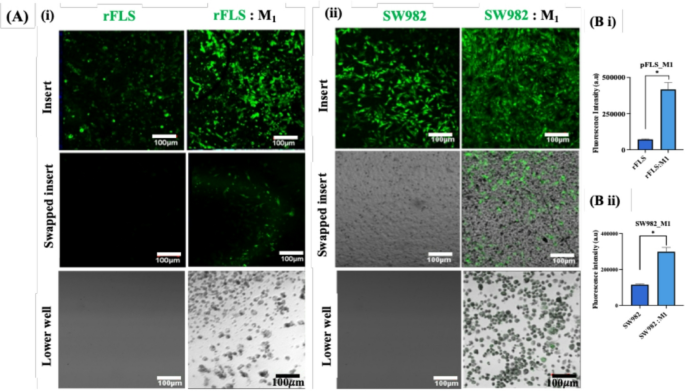
Invasion of synovial fibroblast-like cells toward inflammatory macrophages. (A) CLSM images showing green-labelled primary rFLS and SW982 cells invading through the Matrigel® matrix towards M1 inflammatory macrophages in the lower chamber (Scale bar 100 μm); (B) Quantification of fluorescence intensity of invaded fibroblast-like cells within the Matrigel® matrix (i) Primary rFLS and (ii) SW982 cells co-cultured with M1 macrophages (n = 3; Student’s t-test, *p < 0.05).
Testing MTX as model drug on co-culture system
This simplified 2D co-culture system effectively mimics key characteristics of native RA, including the presence of both fibroblast-like synoviocytes (FLS) and macrophages representative of the intimal synovial layer, cell-cell interaction, expression of inflammatory cytokines and markers. Therefore, it provides a relevant platform for evaluating the therapeutic efficacy of various drug candidates. Testing compounds such as small molecules therapeutics, nanomedicines, or biologics, etc., in such a combinatorial cellular environment may yield more representative and clinically translatable data compared to conventional single-cell type assays. Methotrexate, a first-line anti-inflammatory drug commonly used for RA treatment, was tested in this co-culture system. Figure 16A – D illustrate the effects of MTX on cell stimulation and invasion in the presence of inflammatory macrophages. MTX significantly reduced invasion of both SW982 cells and rFLS through the ECM-mimicking Matrigel® matrix toward M1 macrophages, as compared to untreated controls. These findings highlight the potential of the rFLS–M1 or SW982-M1 co–culture model as a robust in vitro system for evaluating therapeutic efficacy, optimizing drug delivery strategies, and investigating the effects of therapeutics under inflammatory and hypoxic conditions that closely resemble the RA microenvironment.
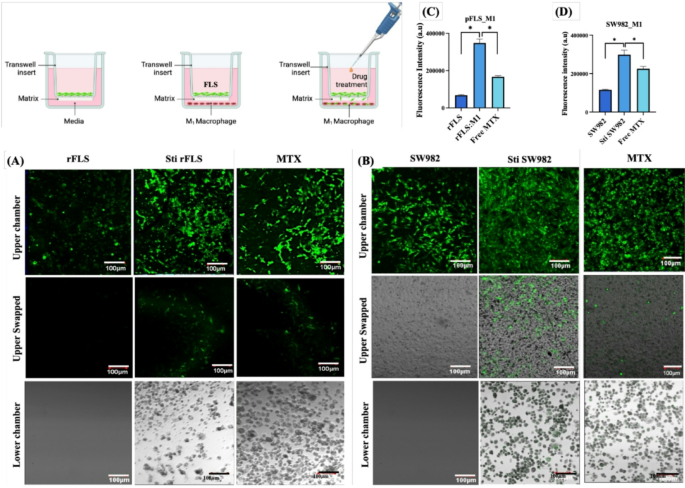
Representative CLSM images showing the effect of Methotrexate (MTX) treatment on (A) rat primary fibroblast-like synoviocytes and (B) human SW982 cells co-cultured with M1 inflammatory macrophages; [C&D] Quantified fluorescence intensity of invaded cells through the Matrigel matrix (n = 3; One-way ANOVA, *p < 0.05).
Conclusion and future perspective
This study presents a simplified yet robust 2D co-culture model that mimics the inflammatory microenvironment of rheumatoid arthritis (RA) by modulating the ratio between fibroblast-like synoviocytes (FLS) and polarized macrophages. The model captures key RA hallmarks, including elevated ROS levels, increased expression of pro-inflammatory cytokines (TNF-⍺, IL-1β, IL-6), morphological transformation of FLS, and enhanced migration and invasion driven by upregulated MMPs. Observable behaviors such as cell clustering and dynamic interactions between FLS and M1 macrophages reflect disease progression and offer insights into synovial cell crosstalk.
Compared to complex 3D systems, this 2D model offers a reproducible, scalable, and high-throughput-compatible platform without compromising physiological relevance. Its translational value is underscored by Methotrexate’s ability to reduce cell invasion in this setup, demonstrating its potential for evaluating therapeutic efficacy.
While this study center on macrophage–FLS interactions, immune cells like T and B lymphocytes are also crucial in RA pathogenesis. Future adaptations may incorporate these cell types using adherent or suspension cultures. Though this adds complexity, it can be addressed through advanced systems such as lab-on-chip or microfluidic platforms, enabling precise, physiologically relevant modelling of the RA synovial environment.

