Higher synovial AXL transcript levels are associated with pauci-immune histology, lower disease activity, and inversely correlate with pro-inflammatory genes
To assess the relationship between AXL/MERTK gene expression, synovial pathotypes and disease activity, we first quantified synovial AXL and MERTK transcripts in a cohort of 87 early treatment-naive patients12. The baseline demographics, clinical and histology features are described in Supplementary Table 1. Notably, at disease presentation, in the absence of previous treatment exposure, AXL was significantly upregulated in pauci-immune patients, defined by the lack of immune cell infiltration, compared with diffuse- and lympho-myeloid patients, characterised by abundant inflammation. MERTK, on the other hand, did not show a preferential expression in any of the three pathotypes (Fig. 1A). Consistently, AXL, but not MERTK, was negatively correlated with all markers of immune cell infiltration within the tissue (Fig. 1B). There was no significant correlation between AXL and MERTK (not shown, r = 0.1, p 0.15), including when this was assessed in relation to the clinical response to conventional synthetic (cs) Disease Modifying Anti-Rheumatic Drugs (DMARDs) treatment at six months (Fig. 1C). Further analysis based on synovium modules defined by weighted gene correlation network analysis (WGCNA), as described in12, showed that while AXL is included in the metabolic pathways module (sc151), characterising pauci-immune and myeloid synovial tissues, MERTK is encompassed in the macrophage module (sc209), which is upregulated in lympho- and diffuse-myeloid patients (Fig. 1D). Importantly, synovial AXL (but not MERTK) inversely correlated with several pro-inflammatory genes like tumor necrosis factor (TNF), Interleukin (IL)−6, IL-1B and C-C motif Chemokine Ligand 8 (CCL8) but positively with its known enhancer Transforming Growth Factor beta (TGFb) (Fig. 1E). As the exposure to different growth factors prompts monocytes to differentiate towards alternative activation states and Axl and MerTK expression is influenced by macrophages/DCs phenotype11, we next analysed the relationship between synovial AXL/MERTK and several critical monocyte/macrophage-growth factors. We observed that each receptor has a distinctive correlation pattern with these key molecules, e.g., AXL positively correlates with Colony Stimulating Factor 1 (CSF1), encoding for M-CSF, which drives alternatively activated macrophages, but negatively with CSF2, encoding for GM-CSF, promoting inflammatory polarisation, while MERTK shows a positive correlation with both CSF1 and CSF2 receptors (Fig. 1E). In order to establish the clinical significance of AXL and MERTK synovial gene expression, we then investigated their relationship with disease activity. Notably, a lower level of Axl synovial gene expression correlated with a higher 28 joint count disease activity score (DAS28) and markers of systemic inflammation such as erythrocyte sedimentation rate (ESR) and C-reactive protein (CRP) (Fig. 1F).
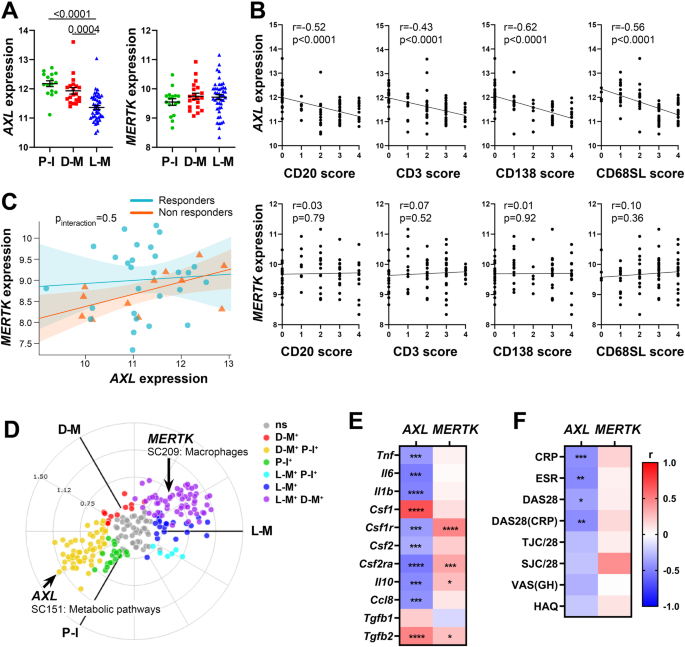
A Axl and MerTK gene expression (regularised-log normalised reads) in synovial tissue of early arthritis treatment-naive RA patients (n = 87) according to the histological pathotype defined as Pauci-Immune (P-I, in green), Diffuse-Myeloid (D-M, in red), and Lympho-Myeloid (L-M, in blue). Data are represented as mean ±SEM. p values indicated were calculated using the Kruskal–Wallis test with Dunn’s post hoc test. B Correlation between synovial AXL (top panels) and MERTK (bottom panels) gene expression and semi-quantitative scores (0–4) of B cells (CD20), T cells (CD3), plasma cells (CD138), and sublining macrophages (CD68SL). p values and r-coefficients were calculated using the two-tailed Pearson correlation test. C Regression model analysis with interaction term to estimate the correlation of AXL with MERTK expression in relation to clinical response to conventional synthetic Disease-Modifying-Anti-Rheumatic-Drugs. The clinical response was assessed by EULAR criteria with DAS28(CRP) after 6-months of treatment (good responders in light blue; moderate and non-responders in orange). p-interaction is not significant. The scatter plots show the regression line of the fitted negative binomial generalised mixed effects model with the error bars showing 95% confidence interval (fixed effects). D 2D polar plot of transcript modules containing AXL and MERTK in synovial tissue characterised by lympho-myeloid (L-M), diffuse-myeloid (D-M), and pauci-immune (P-I) pathotypes. Different colours show pairwise comparisons between the three pathotypes: upregulation in one group only (D-M: red, P-I: green and L-M: blue) or in two groups (D-M/P-I: yellow, L-M/P-I: light blue, L-M/D-M: purple). E, F Heatmaps showing the correlation between AXL and MERTK synovial transcript levels at baseline and cytokines and growth factors relevant to the inflammatory response (E) and clinical parameters (F). The red/blue scale represents the Spearman r coefficient, calculated using the two-tailed Spearman correlation test. *p < 0.05, **p < 0.01, ***p < 0.001, ****p < 0.0001. CRP, C-Reactive Protein; ESR, erythrocyte sedimentation rate; DAS28 disease activity score 28; TJC/28, tender joints count (0-28); SJC/28, swollen joints count (0-28); VAS GH, Visual Analogue Scale General Health (0–100); HAQ health assessment questionnaire.
AXL and MERTK STRING-defined gene-network modules cluster with synovial histopathology and disease activity
To further investigate the inter-relationship of AXL with MERTK as well as the up- and downstream genes linked to either, we defined Axl and MerTK-specific modules composed of 31 predicted partners using STRING network analysis (Supplementary Fig. 1A and Supplementary 1B). We found an expected substantial overlap between these sets: 13 genes were common to both modules and included Axl/MerTK ligand Growth Arrest-Specific gene 6 (GAS6), MerTK ligand Protein S (PROS1), and the Epidermal-Growth-Factor-Receptor (EGFR). Conversely, 18 genes were uniquely present in the Axl or the MerTK module. The former was characterised by PIK3CA/PIK3CB/PIK3R1, encoding for the Phosphoinositide-3-Kinase (PIK3) catalytic subunits p110α/p110β and the regulatory subunit p85α, respectively; IGF1R, encoding for the Insulin-Growth-Factor-Receptor1; IFNAR1, encoding for Interferon α-and-β-Receptor-Subunit1, and the Signal Transducer and Activator of Transcription (STAT)−3. MerTK module included the recently discovered MerTK-ligands TULP and LGALS3, encoding for Galectin 3, a crucial molecule in the synovial microenvironment interaction13; CD64, encoding for Fc-gamma receptor 1A (FcγR1A); and CD28, encoding for the CD80/CD86 receptor (Supplementary Fig. 1C and Supplementary Fig. 1D). Several but not all genes included in the Axl module showed various degrees of correlation with the genes defining the MerTK module and vice-versa, suggesting the existence of both common as well as receptor-specific pathways (Supplementary Fig. 1E).
We then quantified the expression of each module in the synovial tissue from early arthritis treatment-naive patients (n = 81 patients with both RNA-seq and histological classification available). As shown in Fig. 2A, based on the relative expression of the Axl module, we identified three clusters of patients: i. one characterised by lympho-myeloid pathotype, higher synovitis scores, more patients with active disease (DAS28 > 5.1), and defined by the upregulation of Axl gene-partners involved in T-cell activation (ZAP70, LCP2), B-cell development (BLNK) and interferons alpha and beta signalling (IFNAR1); ii. one including patients with pauci-immune and diffuse-myeloid pathotypes, lower synovitis scores, predominantly low- and moderate-disease activity (DAS28 < 5.1), defined by the upregulation of AXL, PROS1, IGF1R, CDH11, EGFR, and ERBB genes; iii. and the third a mixed cluster characterised by both lympho- and diffuse-myeloid pathotypes, with intermediate synovitis scores and disease activity status (Fig. 2A). Considering the amount of gene overlap between the two modules, expectedly, the expression of the MerTK module (Fig. 2C) also clustered in three groups: i.e., one characterised by predominant lympho-myeloid pathotype, higher synovitis scores, DAS28 values predominantly >5.1, and upregulation of MerTK gene-partners encoding for proteins key in survival, proliferation, and activation of T cells (CD28, LCP2), B-cell activation (BLNK), and immune responses (PTPN1, FCGR1A); ii. one mainly containing pauci-immune and diffuse-myeloid pathotypes, lower synovitis scores, low- and moderate-disease activity (DAS28 < 5.1), and characterised by the upregulation of AXL, TAM receptors’ ligands LGALS3 and PROS1, EGFR and ERBB genes; iii. and the third cluster without clear pathotypes, synovitis scores and disease activity scores signature. The overall expression of both Axl and MerTK modules was significantly higher in the pauci-immune cell-poor synovial tissue compared with the cell-rich lympho- and diffuse-myeloid (Fig. 2B, D), indicating that quantitative gene expression is not simply the result of the level of synovial cellular infiltration.
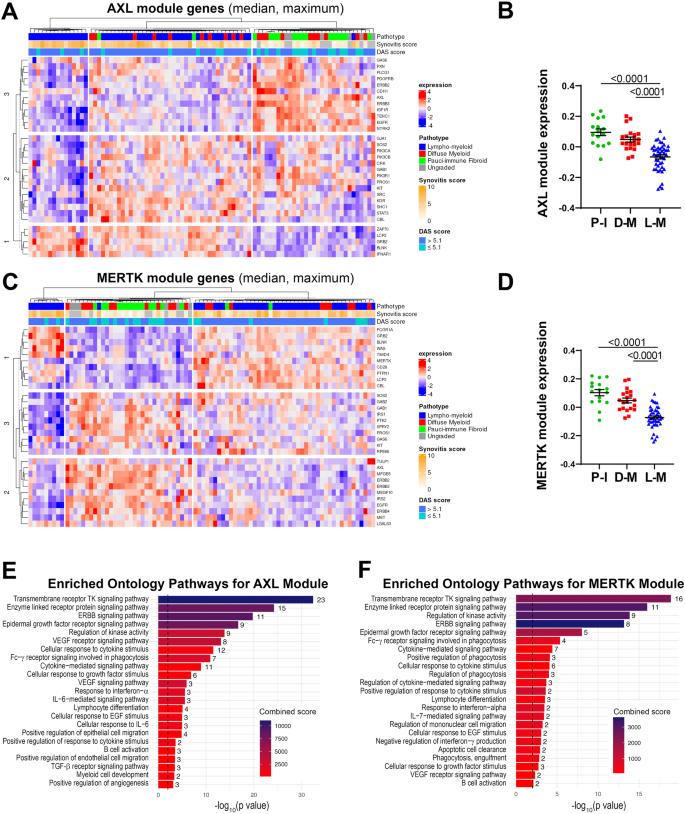
A, C Heatmaps showing regularised-log-transformed expression for all genes in the Axl module (A) and the MerTK module (C), (B, D) Axl module (B) and MerTK module (D) expression in synovial tissue of early arthritis treatment-naive RA patients (n = 81) according to the histological pathotype defined as Pauci-Immune (P-I, in green), Diffuse-Myeloid (D-M, in red), and Lympho-Myeloid (L-M, in blue). Data are represented as mean ±SEM. p values indicated were calculated using the Kruskal–Wallis test with Dunn’s post hoc test. E, F Enriched ontology pathways for the Axl module (E) and MerTK module (F). Nominal p values from gene set enrichment analysis are shown.
Using gene set enrichment analysis (GSEA), we observed a substantial overlap of pathways enriched in both Axl and MerTK modules, including Tyrosine Kinases, ERBB, FcγR signalling pathways, and response to Interferon-α (Fig. 2E, F). Notably, however, the Axl module was distinctively linked to the IL-6-mediated signalling pathway and cellular response to IL-6, TGF-β receptor signalling, and regulation of angiogenesis (Fig. 2E). Conversely, the MerTK module was associated specifically with enrichment in phagocytosis and apoptotic cells clearance pathways (Fig. 2F).
Taken together, these data showed that Axl/MerTK gene expression, as well as Axl-/MerTK STRING modules and related pathways, are linked to synovial histopathology.
Axl is preferentially expressed by lining layer cells and its ectodomain can be cleaved and released in the synovial fluid
As topographical distribution is often associated with positional function, we investigated Axl and MerTK expression at the protein level within the distinct lining and sublining areas of the RA synovial tissue. We show that, in early treatment-naive RA synovia, Axl was predominantly expressed within the lining layer and barely found in the sublining region (Fig. 3A), in line with data in animal models and patients with established late RA2,3. Since the lining is composed of macrophages and fibroblasts-like-synoviocytes (FLS), we performed multiplex-Immuno Fluorescence (IF) staining with the pan-macrophage marker CD68 and the fibroblast markers CD55 (typically expressed by lining-FLS) to confirm lineage-specific Axl surface expression. As shown in Fig. 3B, Axl is expressed by either CD68+ lining macrophages or CD55+ lining FLS. As fibroblasts are known to have a positional identity within the tissue, represented by distinct surface markers9,13, we next confirmed that Axl expression was specific to CD55+ lining fibroblasts, while not detected in sublining CD90/Thy+ stromal cells (Supplementary Fig. 2A). Recent work within the accelerating medicines partnership (AMP) consortium showed that at least four FLS subsets, characterised by specific markers, could be identified in RA synovium by scRNA-seq, in line with our protein data, we confirmed that AXL was higher in the CD55 + SC-F4 (Supplementary Fig. 2B), more abundant in the lining and leucocyte-poor RA (Supplementary Fig. 2C). Also importantly, despite the marked infiltration of CD68+ cells in the sublining, most interstitial macrophages did not express Axl on their surface (Fig. 3B).
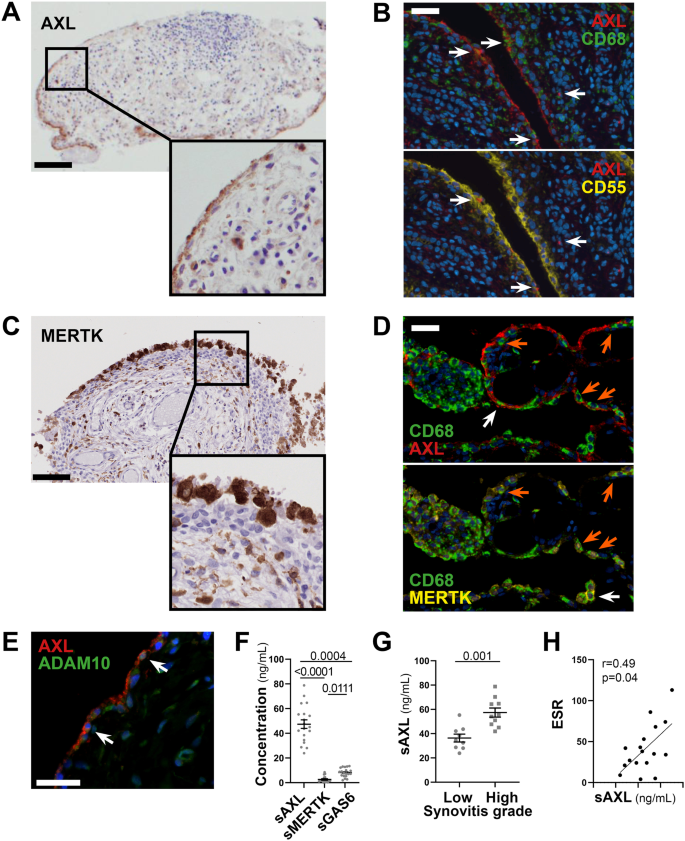
A, C Representative images of Axl (A) and MerTK (C) immunohistochemistry (IHC) staining of synovial tissue sections. Scale bar = 100 μm. Representative images of n = 20 samples stained. B Double immunostaining of Axl (red) with CD68 (green, upper panel) and CD55 (yellow, lower panel) in the synovium of RA patients. Nuclei were counterstained with DAPI (blue). White arrows indicate double-positive cells. Scale bar = 50 μm. Representative images of n = 13 samples stained. D Triple immunostaining of Axl (red), MerTK (yellow), and CD68 (green) in the synovium of RA patients showing the presence of both Axl+ and MerTK+ double-positive CD68+ macrophages (orange arrow) and Axl+ or MerTK+ single positive CD68+ macrophages (white arrow). Nuclei were counterstained with DAPI (blue). Scale bar = 50 μm. Representative images of n = 18 samples stained. E Double immunostaining of Axl (red) with ADAM10 (green) in the synovium of RA patients. Nuclei were counterstained with DAPI (blue). White arrows indicate double-positive cells. Scale bar = 50 μm. Representative images of n = 5 samples stained. F Levels of soluble Axl (sAxl), soluble MerTK (sMerTK) and soluble Gas6 (sGas6) in ng/mL assessed by ELISA in the synovial fluid of RA patients (n = 18). p values indicated were calculated using the Kruskall–Wallis test, with Dunn’s post hoc test. G Levels of soluble Axl (sAxl) in ng/mL assessed by ELISA in the synovial fluid of RA patients (n = 18) divided according to synovitis score (low [0–4], high [5-9]). p values indicated were calculated using the two-tailed Mann–Whitney test. F, G Data are represented as mean ±SEM. H Correlation between sAxl synovial fluid levels and the erythrocyte sedimentation rate (ESR) of RA patients (n = 18). p value and r coefficient were calculated according to the two-tailed Spearman correlation test.
Conversely, MerTK was predominantly expressed by CD68+ macrophages. Like Axl, MerTK was preferentially found in the lining but also expressed in the sublining (Fig. 3C) and in the lymphocytic aggregates by tingible-body-macrophage-like cells. Macrophages of the lining could express either MerTK alone, Axl alone or co-express MerTK and Axl, suggesting that distinct macrophage lineage states co-exist in the lining (Fig. 3D).
Given the ability of Axl and MerTK ectodomains to be cleaved by metalloproteases11, and in keeping with previous reports showing that soluble Axl (sAxl) is abundant in the synovial fluid of RA patients6, we confirmed that both Axl-bearing and Axl-negative cells expressed the cleaving enzyme ADAM10, including within the synovial region facing the joint cavity (Fig. 3E). Next, we quantified the soluble extracellular domain of Axl (sAxl), MerTK (sMerTK), and their ligand Gas6 in the SF obtained at the same time as the synovial biopsy in a subset of early arthritis untreated patients (Supplementary Table 2). In these matched samples, we demonstrated that SF sAxl was present in excess compared to sMerTK and its ligand Gas6 (Fig. 3F), in line with Axl’s role as a decoy receptor14. Interestingly, SF sAxl levels, but not sMerTK or Gas6 levels (Supplementary Fig. 3A, B), were significantly raised in patients with a high degree of synovial inflammation (Fig. 3G), suggestive of an unsuccessful homoeostatic reaction attempting to restrain tissue inflammation. Only SF sAxl also positively correlated with markers of systemic inflammation like ESR (Fig. 3H and Supplementary Fig. 3B, D), further corroborating that Axl cleavage may play an immuno-modulatory role as previously proposed in other autoimmune diseases.
Axl and MerTK synovial expression in relationship with clinical features are influenced by the disease stage and treatment exposure
To define whether the synovial expression of AXL and MERTK varies according to the disease stage and is modulated by treatment exposure, we compared AXL and MERTK RNA expression from the early arthritis cohort to a cohort of late, difficult-to-treat (D2T) RA patients, characterised by an inadequate response (ir) to csDMARDs and at least one TNFα inhibitor (TNFα-ir) prior to randomisation to a second-line biologic agent (either rituximab -RTX- or tocilizumab -TOC) in the R4RA biopsy-driven randomised clinical trial, described in refs. 15,16; data available at https://r4ra.hpc.qmul.ac.uk/.
At this late D2T disease stage, similarly to the early phase (Fig. 1A, B), AXL was significantly higher in low-inflamed tissues (pauci-immune) (Fig. 4A) and significantly negatively correlated with all markers of immune cell tissue infiltration (Fig. 4B). MERTK was instead significantly upregulated in diffuse-myeloid and lympho-myeloid patients (Fig. 4C) and positively correlated with the inflammatory cellular infiltrate (Fig. 4D), suggesting that the exposure to medications such as corticosteroids, csDMARDs, and TNF inhibitors and/or uncontrolled tissue inflammation might alter MerTK expression. To further elucidate how different cell types (stromal, myeloid) influence the modulation of Axl and MerTK receptors in an inflamed environment, we set up two in vitro systems of macrophage-FLS interaction using conditioning media, as described in Supplementary Fig. 4A. We observed that macrophages did not influence sAxl, sMerTK, or Gas6 release by conditioned RA-FLS, independently of the macrophage polarisation status (Fig. 4E and Supplementary Fig. 4B); conversely, macrophages conditioned with TLR4-stimulated RA-FLS significantly decreased sMerTK release in the supernatants. Consistently, sMerTK/sAxl ratio was significantly lower when compared with conditioning by unstimulated FLS (Fig. 4F).
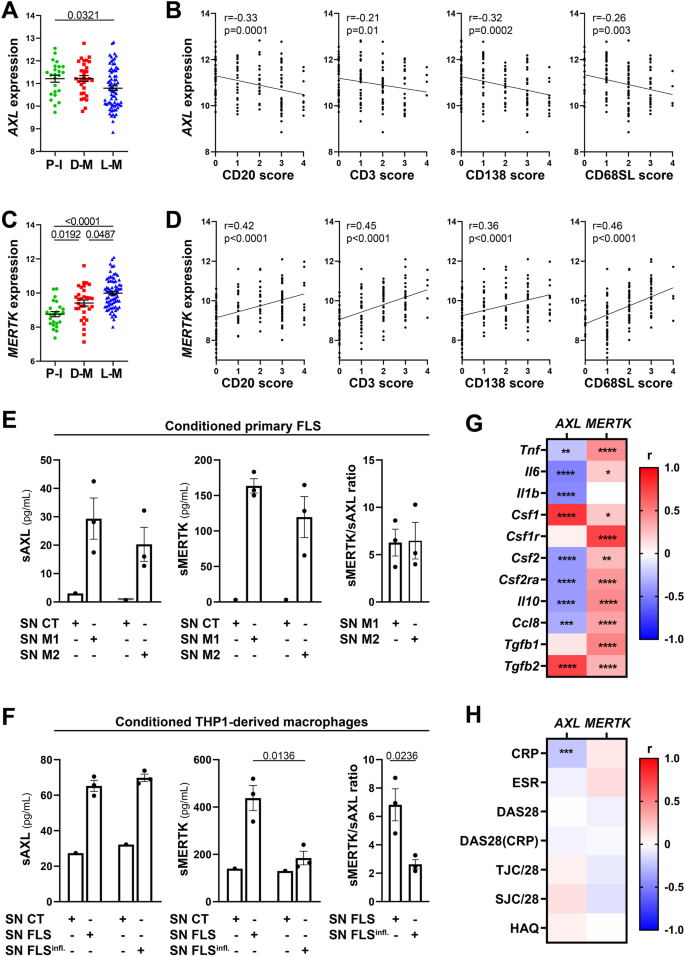
A, C AXL (A) and MERTK (C) gene expression (vst normalised reads) in synovial tissue of anti-TNF inadequate responder RA patients (R4RA cohort, n = 133) according to the histological pathotype defined as Pauci-Immune (P-I, in green), Diffuse-Myeloid (D-M, in red), and Lympho-Myeloid (L-M, in blue). Data are represented as mean ±SEM. p values were calculated using the Kruskal–Wallis test with Dunn’s post hoc test. B, D Correlation between synovial AXL (B) and MERTK (D) gene expression and semi-quantitative scores (0–4) of B cells (CD20), T cells (CD3), plasma cells (CD138), and sublining macrophages (CD68SL). p values and r-coefficients were calculated using the two-tailed Pearson correlation test. E Expression of sAxl, sMerTK (pg/mL) or the ratio between sMerTK and sAxl in the supernatant of primary fibroblasts-like synoviocytes (FLS) conditioned with supernatant from M1-polarised THP1 (SN M1) or M2-polarised THP1 (SN M2), or in the respective medium used to condition the cells (SN CT). F Expression of sAxl, sMerTK (pg/mL) or the ratio between sMerTK and sAxl in the supernatant of THP1-derived macrophages conditioned with supernatant from unstimulated RA-FLS (SN FLS) or LPS stimulated FLS (SN FLS Infl.), or in the respective medium used to condition the cells (SN CT). E, F Data are represented as mean ±SEM. p values indicated were calculated using the unpaired two-tailed t test (left and middle panels) or the two-tailed Mann–Whitney test (right panel). Experiments were performed on n = 3 distinct patient-derived FLS. G, H Heatmaps showing the correlation between AXL and MERTK synovial transcript levels at baseline and cytokines and growth factors relevant to the inflammatory response (G) and clinical parameters (H). The red/blue scale represents the Spearman r coefficient, calculated using the two-tailed Spearman correlation test. *p < 0.05, **p < 0.01, ***p < 0.001, ****p < 0.0001. CRP C-reactive protein, ESR erythrocyte sedimentation rate, DAS28 disease activity score 28, TJC/28 tender joints count (0–28), SJC/28 swollen joints count (0-28), HAQ health assessment questionnaire.
At this late stage of RA, similarly to what we observed in the early treatment-naive cohort (Fig. 1E), AXL maintained a significant negative correlation with most cytokines, including TNF, IL-6, CCL8, and IL-10, but positive with CSF1 and TGFB2 (Fig. 4G). Unlike the early treatment-naive patients (Fig. 1E) and opposite to Axl behaviour, synovial MerTK showed a strong positive correlation with most cytokines/chemokines pathogenetically relevant in RA (Fig. 4G). In keeping with its regulatory role, lower levels of Axl synovial gene expression were significantly associated with higher CRP (Fig. 4H) but not with other clinical parameters, while no clinical correlation was observed for MERTK.
Synovial Axl gene expression is modulated by the anti-IL-6 targeting treatment
To corroborate the known ability of TAM receptors to regulate inflammatory processes in RA, we next assessed the potential clinical implications of pre-treatment expression of Axl/MerTK in the synovium of patients in whom TNF inhibitors were ineffective about to receive either rituximab (RTX) or tocilizumab (TOC).
Notably, regression analysis revealed a significant differential AXL/MERTK correlation between responders and non-responders (pinteraction = 0.018) following IL-6 inhibition (TOC-treated) (Fig. 5A), whilst this difference was not observed in the RTX-treated arm (pinteraction = 0.64), where AXL and MERTK were weakly correlated (Fig. 5B).
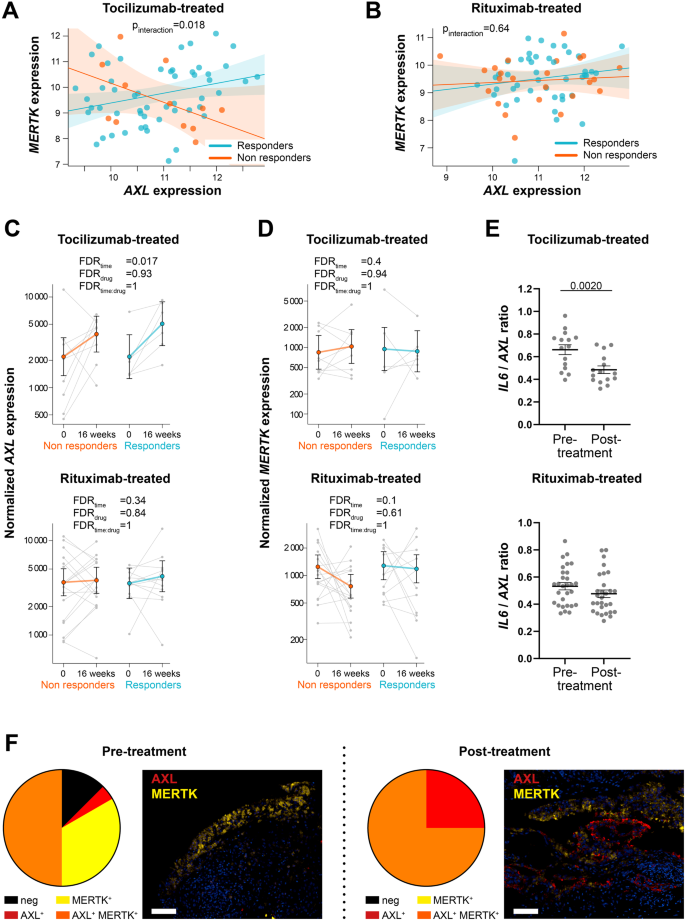
A, B Linear regression model analysis with interaction term to estimate the correlation of AXL with MERTK expression in relation to clinical response to tocilizumab (A) and rituximab (B) in anti-TNF inadequate responder RA patients (R4RA cohort, n = 133, including 65 tocilizumab-treated and 68 rituximab-treated patients). The clinical response was assessed by EULAR criteria with DAS28(CRP) after 16 weeks of treatment (good responders in light blue; moderate and non-responders in orange). p-interaction is significant (0.018) in the tocilizumab-treated patient group and not significant in the rituximab-treated patient group. The scatter plots show the regression line of the fitted negative binomial generalised mixed effects model with the error bars showing 95% confidence interval (fixed effects). C, D AXL (C) and MERTK (D) normalised gene expression levels assessed at baseline and 16 weeks following tocilizumab (left panels, n = 15 matched samples) or rituximab (right panels, n = 29 matched samples) treatment. CDAI 50% improvement was used to assess the clinical response (responders in light blue, non-responders in orange). Statistical analysis was performed by negative binomial generalised mixed effects model. FDR: false discovery rate. Data are shown as mean ±95% confidence interval. E IL-6/AXL expression ratio in the synovial tissue of tocilizumab- (n = 15) or rituximab- (n = 29) treated patients. Data are represented as mean ±SEM. p values indicated were calculated using the two-tailed Wilcoxon test for paired data. F Pie chart showing the percentage of Axl or MerTK single positive, MerTK and Axl double-positive and negative synovial tissue of anti-TNF inadequate responder RA patients (R4RA cohort) at baseline pre- (n = 24) and post-treatment with either tocilizumab or rituximab (RTX-treated n = 3, TOC-treated n = 5) (left panels) and representative images of double immunofluorescence staining for Axl (red) and MerTK (yellow) (right panels). Scale bar = 50 μm.
The close link between IL-6 and TAM receptors was also suggested by the significant upregulation of AXL synovial expression upon the blockade of IL-6 with TOC in both responders and non-responders (Fig. 5C). AXL significant enhancement was not observed upon B-cell depletion by the anti-CD20 RTX (Fig. 5C), while MERTK expression in this cohort was not significantly influenced by any of these treatments (Fig. 5D). In line with these observations, the ratio AXL/IL6 was significantly downregulated following treatment with TOC but not RTX (Fig. 5E).
We next assessed how treatment interventions regulated Axl and MerTK protein expression in CD68+ synovial macrophages in the TNFα inhibitors-ir cohort. A qualitative analysis of 24 pre-treatment (RTX n = 16, TOC n = 8) and 8 post-treatment (RTX n = 3, TOC n = 5) synovial tissues showed that following biologic therapies, all synovial macrophages acquired Axl expression on their surface, which was expressed either alone or co-expressed with MerTK. Notably, about 75% of macrophages pre- and post-treatment were MerTK+ (Fig. 5F).
Digital spatial profiling defines the positional identity of AXL and MERTK gene expression in rheumatoid synovium
Since positional identity has recently been reported to play an important role in the rheumatoid synovial tissue3,17, we further investigated the molecular expression of AXL, MERTK and their gene partners in relation to their spatial distribution by applying digital spatial profiling (DSP) with the NanoString GeoMX DSP. ROIs selected for profiling consisted of lining, deep sublining and lymphocytic aggregates (Fig. 6A).
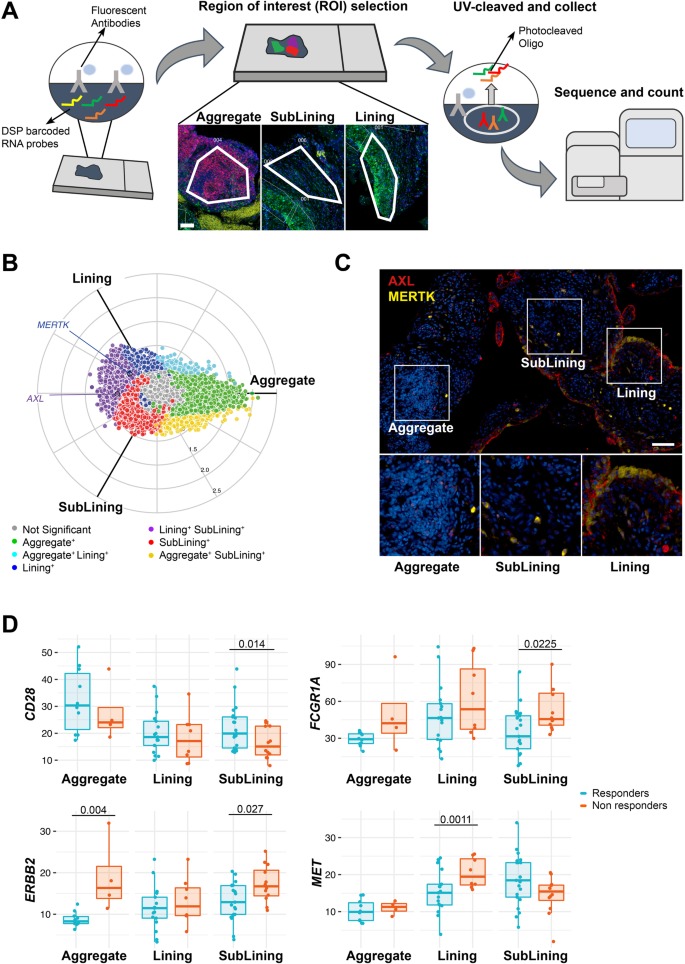
A Schematic representation of the Digital Spatial Profiling (DSP) approach, including the selection of three regions of interest (ROI): aggregate (characterised by the presence of CD3+ and CD20+ cells), deep sublining (characterised by the absence of CD3+ and CD20+ cells) and lining with superficial sublining (characterised by the presence of CD68+ cells). Scale bar = 100 μm. DSP was performed on 14 aggregates, 25 lining, and 33 sublining regions. B Three-way radial plot showing differential and overlapping genes across aggregate (green), lining (blue) and sublining (red) regions. AXL and MERTK genes have been labelled showing a significantly higher presence of AXL in both lining and sublining regions and a significant presence of MERTK in the lining region. Significance was internally estimated by the volcano3D package combining significance (q < 0.05) from both one-way ANOVA and pairwise T test. C Double immunostaining of Axl (red) and MerTK (yellow) in the aggregate, sublining and lining synovial areas of RA patients. Nuclei were counterstained with DAPI (blue). Scale bar = 50 μm. Representative images of n = 32 samples stained. D Expression of selected individual genes included in the AXL and/or MERTK networks in the aggregate (n = 14, including 4 non-responder and 10 responder patients), sublining (n = 33, including 12 non-responder and 21 responder patients) and lining (n = 25, including 8 non-responder and 17 responder patients) synovial areas of responders (light blue) and non-responders (orange) RA patients to either tocilizumab or rituximab. Boxplots represent the median and first and third quartiles, and whiskers span to the minimum and maximum. A paired Wilcoxon test was undertaken to compare responders and non-responders.
Both AXL and MERTK were upregulated in lining and sublining compared to lymphocytic aggregates (Supplementary Fig. 5), reflecting the lineage expression by macrophages and fibroblasts. In line with the protein data, and as shown in the polar plot (Fig. 6B), we demonstrated that MERTK gene expression was upregulated in the lining layer (Fig. 6C). On the other hand, AXL transcript was among the genes upregulated in both lining and sublining, suggesting the existence of post-translational mechanisms able to specifically downregulate its expression at the protein level in cell-subsets of the sublining (e.g., Thy-1+ FLS).
We next compared the expression of Axl, MerTK, and their gene partners in responders (to either RTX or TOC, n = 8) versus refractory patients (who failed both RTX and TOC, n = 4) in each synovial region. Among MerTK partners, CD28 was upregulated in the sublining of responders, while FCGR1A/CD64 and c-MET were significantly upregulated in refractory patients (sublining and lining, respectively). ERRB2, common to both Axl and MerTK modules, was also upregulated in sublining and aggregates of refractory patients (Fig. 6D). Even if the differential expression of AXL and MERTK did not reach statistical significance, taken together, these data further confirm that Axl and MerTK define distinct subsets of synovial cell populations and closely interact with biologic partners that are clinically relevant.


