ORM2 expression is upregulated in RA patients by proinflammatory stimuli
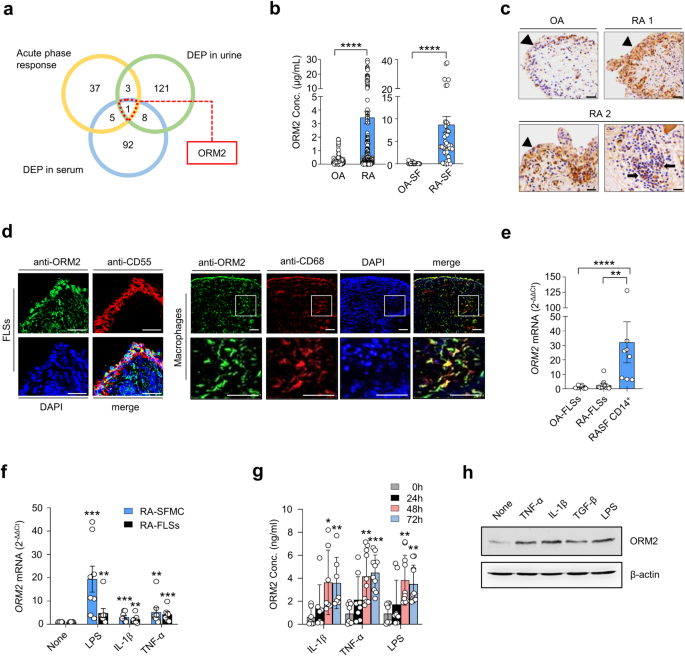
A global analysis to determine which acute phase reactants are involved in rheumatoid inflammation has not yet been performed. To address this knowledge gap, we conducted a comparative analysis of DEPs in RA sera (106 genes), DEPs in RA urine (133 genes), and 46 genes defined as acute phase reactants by Gene Ontology (GO) (Fig. 1a). We identified 9 acute phase reactants upregulated in the sera and/or urine samples of RA patients. Among these genes, ORM2 exhibited the highest fold change. Thus, it was selected as a potential regulator involved in RA pathology (Fig. 1 and Supplementary Fig. 1). Indeed, the ORM2 expression levels were much greater in the sera and synovial fluids of the RA patients than in those of the OA patients (mean ± SEM: 3.5 ± 0.47 μg/mL vs. 0.26 ± 0.04 μg/mL in the sera and 8.7 ± 1.8 μg/mL vs. 0.12 ± 0.04 μg/mL in the synovial fluids) (Fig. 1b). In addition, immunohistochemical staining revealed that ORM2 was more highly expressed in RA synovia than in OA synovia, particularly in the lining layer and sublining leukocytes (Fig. 1c).
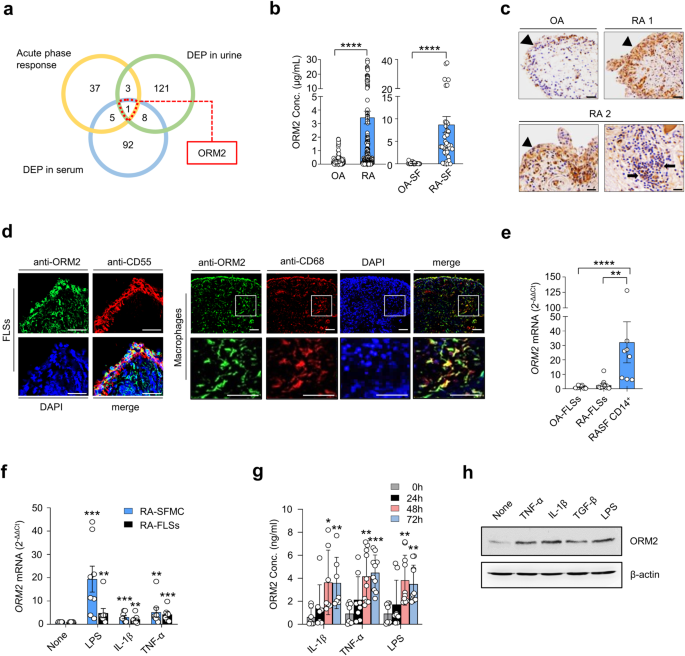
a Venn diagram depicting the number of common and distinct acute phase response proteins, differentially expressed proteins (DEPs) in RA patient urine, and DEPs in RA patient serum. b ORM2 concentrations in the sera of RA patients (n = 179, left panel), the sera of osteoarthritis (OA) patients (n = 109, left panel), the synovial fluids of RA patients (RA-SF; n = 40, right panel), and the synovial fluids of OA patients (OA-SF; n = 25, right panel) as determined by ELISA. The bar graphs represent the mean ± SD. ****P < 0.0001 according to the Mann‒Whitney U test. c Immunohistochemical staining for ORM2 in the synovial tissues of RA patients (RA1 and RA2) and an OA patient using anti-ORM2 antibodies (Abs). Arrowheads and arrows indicate the lining layer and sublining leukocytes, respectively. Scale bars: 50 μm. d Double immunofluorescence staining of RA synovial tissue using Abs against ORM2, CD55, and CD68. Scale bars: 50 μm. The rectangular area in the top panel is magnified to the bottom panel. Scale bars: 50 μm. See Supplementary Fig. 2 for the immunofluorescence staining of the synovium from three other RA patients. e qRT‒PCR assays for ORM2 expression in cultured fibroblast-like synoviocytes from OA patients (OA-FLSs, n = 12), cultured FLSs from RA patients (RA-FLSs, n = 12), and CD14+ macrophages/monocytes (n = 8) isolated from the synovial fluids of RA patients as determined by qRT‒PCR. ORM2 mRNA expression levels were first normalized to those of GAPDH (internal control) and subsequently further normalized to the mean mRNA expression level in OA-FLSs. f Induction of ORM2 in RA mononuclear cells and RA-FLSs by LPS and proinflammatory cytokines. Mononuclear cells (5 × 10⁵) freshly isolated from the synovial fluid of RA patients (RA-SFMCs) and RA-FLSs (2 × 10⁵) were stimulated with LPS (1 μg/mL), TNF-α (10 ng/mL), or IL-1β (1 ng/mL) for 24 h. ORM2 mRNA expression levels, which were determined by qRT‒PCR, were first normalized to the expression of GAPDH and subsequently further normalized to the mean mRNA expression in unstimulated cells. g ORM2 secretion by CD14+ cells. CD14+ cells were isolated from RA synovial fluids and then stimulated with IL-1β (1 ng/mL), TNF-α (10 ng/mL), and LPS (1 μg/mL) for the indicated times. ORM2 levels in culture supernatants were measured via ELISA. h Western blot analysis of ORM2 expression in RA-FLSs. RA-FLSs were stimulated with TNF-α (10 ng/mL), IL-1β (1 ng/mL), TGF-β (10 ng/mL), and LPS (1 μg/mL) for 48 h; a representative of more than three experiments is shown. The data are presented as the mean ± SEM of more than three independent experiments. *P < 0.05, **P < 0.01, ***P < 0.001, and ****P < 0.0001 according to the Kruskal–Wallis test (E: P = 0.0001, RA-SFMC in (f): P = 0.0001; RA-FLSs in (f): P = 0.0027; IL-1β in (g): P = 0.0025; TNF-α in (g): P = 0.0002; and LPS in (g): P = 0.0004) with Dunn’s multiple comparisons test for (e) and (g) or with post hoc pairwise comparisons test using a Mann–Whitney U test for (f).
The lining of the synovium in RA patients is composed of macrophage-like synoviocytes and FLSs27. Immunofluorescence staining revealed that ORM2-expressing cells colocalized well with CD55+ and CD68+ cells, which are markers of FLSs and macrophages, respectively, indicating that these cells were the major cells expressing ORM2 (Fig. 1d and Supplementary Fig. 2a, b). The use of only the secondary Abs without either the anti-ORM2 Ab or the anti-CD68 Ab failed to stain the ORM2- or CD68-expressing cells, respectively (Supplementary Fig. 2c). Moreover, preabsorption of the anti-ORM2 Ab with recombinant ORM2 markedly inhibited ORM2 staining in CD68+ cells (Supplementary Fig. 2d), indicating the specificity of the anti-ORM2 Ab. To further confirm the presence of ORM2 in the RA synovium, we isolated FLSs and macrophages from synovial membranes and synovial fluids, respectively, and measured ORM2 expression levels. As a result, freshly isolated CD14+ cells from RA patients had significantly higher levels of ORM2 mRNA than FLSs from RA patients (RA-FLSs) and FLSs from OA patients (OA-FLSs) (Fig. 1e). The mean ORM2 mRNA expression levels in RA CD14+ cells were 12.5-fold and 27.8-fold higher than those in RA-FLSs and OA-FLSs, respectively (Fig. 1e). The expression of ORM2 mRNA was 2.2-fold higher in RA-FLSs than in OA-FLSs, but this difference was not statistically significant (p = 0.11) (Fig. 1e).
The RA synovium is heavily exposed to a variety of proinflammatory stimuli, including Toll-like receptor ligands and inflammatory cytokines. As shown in Fig. 1f, stimulation of synovial fluid mononuclear cells (SFMCs) from RA patients (RA-SFMCs) with LPS, IL-1β, or TNF-α resulted in a substantial increase in ORM2 mRNA expression levels—by 19.4-, 3.1-, and 5.2-fold, respectively—compared to treatment with medium alone. This increase in ORM2 mRNA expression levels was not observed in macrophages treated with IL-6 (Supplementary Fig. 3a). ORM2 transcript levels in RA-FLSs were also significantly increased by LPS, IL-1β, TNF-α, and TGF-β stimuli—up to 4.8-, 2.1-, 4.2-, and 2.9-fold, respectively—but not by other cytokines, such as IL-6, M-CSF, or IL-10 (Fig. 1f and Supplementary Fig. 3b). ORM2 protein production was also markedly increased in the synovial fluid CD14+ cells of RA patients and in RA-FLSs after stimulation with proinflammatory stimuli, including LPS, IL-1β, and TNF-α, as well as the profibrotic cytokine TGF-β (Fig. 1g, h).
In summary, ORM2 expression was upregulated in the extrahepatic sites, including synovial fluids and synovial membranes, of RA patients, and it was upregulated by proinflammatory stimuli. The major cell types producing ORM2 were synovial macrophages and fibroblasts.
ORM2 directly increases the production of IL-6, CXCL8, and CCL2 by RA-FLSs and macrophages
Next, we investigated whether ORM2, like several other acute phase reactants5,6,7,8,9, could functionally regulate inflammatory responses and contribute to RA pathogenesis. To this end, we treated RA-FLSs and macrophages with recombinant ORM2 and tested whether ORM2 could induce the production of proinflammatory cytokines. The results showed that recombinant ORM2 dramatically increased the production of IL-6, CXCL8, and CCL2 by RA-FLSs in a dose- and time-dependent manner (Fig. 2a). The effect of recombinant ORM2 persisted even when polymyxin B, a compound that blocks LPS-induced TLR4 activation, was present. In contrast, the LPS-induced increase in IL6 and CXCL8 expression levels was completely inhibited by polymyxin B (Supplementary Fig. 4a). After stimulation with 1 μg/mL ORM2 for 72 h, the levels of IL-6, CXCL8, and CCL2 produced by RA-FLSs increased 3.6-, 10.3-, and 3.4-fold, respectively, relative to those observed after treatment with medium alone (Fig. 2a). These increases did not seem to be due to cell proliferation since the number and viability of FLSs were not altered according to the results of trypan blue exclusion and the MTT assay, respectively, at 72 h after stimulation with 0.1 to 1 μg/mL ORM2 (Supplementary Fig. 4b). After treatment with exogenous ORM2, the IL6, CXCL8, and CCL2 mRNA expression levels also markedly increased by 6.4-, 10.7-, and 2.4-fold, respectively, compared to those in the medium-treated control (Fig. 2b), indicating that these increases were transcriptionally regulated. Similarly, ORM2-stimulated RA-SFMCs dose-dependently increased the production of IL-6 and TNF-α (Fig. 2c). In parallel, recombinant ORM2 time-dependently increased IL-6 and TNF-α secretion from the macrophages of healthy controls, which were differentiated from peripheral monocytes (Fig. 2d). The secretion of CXCL8 and CCL2 from healthy macrophages was also robustly promoted by exogenous ORM2 (Supplementary Fig. 4c). Furthermore, in RA synovial fluid, a modest correlation was found between the ORM2 concentration and the CXCL8 and CCL2 levels (Fig. 2e, f). Taken together, these results suggest that upregulated ORM2 in RA joints can directly stimulate RA-FLSs and macrophages, known as effector cells in RA, to induce the production of proinflammatory cytokines and chemokines, thereby further amplifying inflammatory responses.
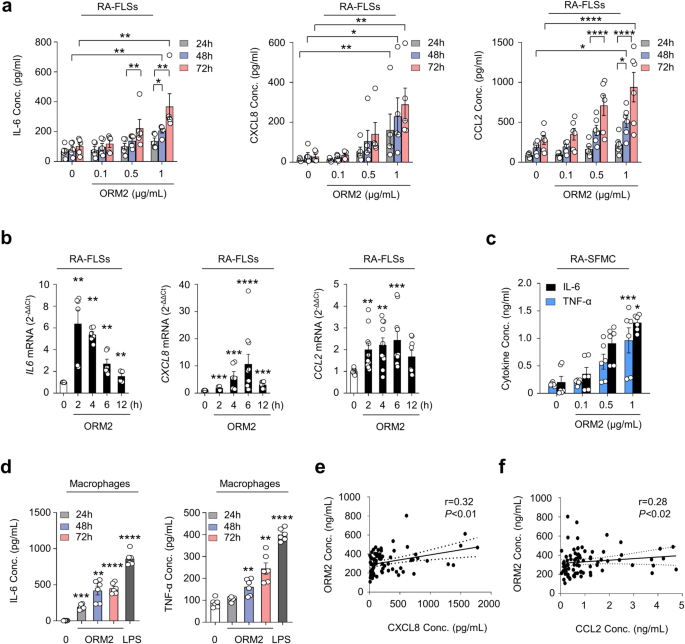
a Upregulation of IL-6, CXCL8, and CCL2 expression in RA-FLSs induced by recombinant ORM2. RA-FLSs (2 × 10⁴, n = 5–6) were cultured in DMEM supplemented with 1% FBS and stimulated with recombinant ORM2 at various concentrations (0.1 to 1 μg/mL) in the presence of polymyxin B (30 μg/mL) for the indicated times. The IL-6 and CXCL8 concentrations (Conc.) in the culture supernatants were measured via ELISA. b ORM2 upregulated the mRNA expression of the IL6, CXCL8, and CCL2 in RA-FLSs, as determined by qRT‒PCR. RA-FLSs were stimulated with recombinant ORM2 (1 μg/mL) for the indicated times. GAPDH mRNA was used as an internal control. c, d ORM2 increased IL-6 and TNF-α production in synovial fluid mononuclear cells from RA patients (RA-SFMCs) (c) and in macrophages differentiated from peripheral monocytes (d). RA-SFMCs (1 × 10⁶) were freshly isolated from the synovial fluids of RA patients and then stimulated with various concentrations of ORM2 (0.1–1 μg/mL) for 72 h. Peripheral monocytes were obtained from blood samples of healthy donors (n = 6) and differentiated into macrophages by incubating them in the presence of M-CSF (20 ng/mL) for 3 days. The resulting macrophages (1 × 10⁶) were stimulated with recombinant ORM2 (1 μg/mL) in the presence of polymyxin B (30 μg/mL) for the indicated times. IL-6 and TNF-α levels in culture supernatants were determined via ELISA. The data in (a–d) represent the mean ± SEM of more than three independent experiments. *P < 0.05, **P < 0.01, ***P < 0.001, and ****P < 0.0001 according to the Friedman test (IL-6 in a: P < 0.0001, CXCL8 in A: P < 0.0001) with post hoc pairwise comparisons using a Mann–Whitney U test; two-way ANOVA (P < 0.0001) with Tukey’s multiple comparisons test for CCL2 in (a); Kruskal–Wallis test (IL6 in (b): P = 0.0001; CXCL8 in (b): P < 0.0001; CCL2 in (b): P = 0.003; and TNF-α in (c): P = 0.009) with post hoc pairwise comparisons using the Mann–Whitney U test for IL6 and CXCL8 in (b) or with Dunn’s multiple comparisons for CCL2 in (b) and TNF-α in (c); and Brown-Forsythe and Welch ANOVA (IL-6 in (c): P = 0.0084, IL-6 in (d): P < 0.0001, and TNF-α in (d): P < 0.0001) with the Dunnett T3 multiple-comparison test versus untreated cells. e, f Scatter plot presenting the correlations between the ORM2 concentration and the CXCL8 (e) or CCL2 (f) level in RA synovial fluid (n = 81). The data were assessed by Spearman’s correlation coefficient analysis.
NF-κB and p38 are major signals for ORM2-induced proinflammatory responses
We further investigated which signaling pathways are involved in the regulation of cytokine and chemokine production by ORM2. A number of studies have demonstrated that NF-κB and p38 MAP kinase are major signaling molecules responsible for IL-6, CXCL8, and CCL2 production in RA-FLSs28. To determine how ORM2 induces IL-6 and CXCL8 production, we treated RA-FLSs with recombinant human ORM2 in the presence of chemical inhibitors specific for NF-κB and p38 MAP kinase. As expected, NF-κB inhibitors such as pyrollidine dithiocarbamate (PDTC) and BAY117082 substantially suppressed ORM2-induced increases in IL6 and CXCL8 mRNA expression levels (Fig. 3a); the suppressive effect of the BAY inhibitor on IL6 upregulation was less pronounced than that on CXCL8 upregulation, suggesting that the NF-κB pathway partially contributes to the production of CXCL8 induced by ORM2. Additionally, the p38 MAP kinase inhibitor SB203580 strongly inhibited the upregulation of the IL6 and CXCL8 mRNAs in RA-FLSs stimulated with ORM2 (Fig. 3a). Similarly, in macrophages from healthy controls, the increase in IL6 and CCL2 expression levels induced by ORM2 was almost completely suppressed by SB203580, PDTC and BAY117082 (Supplementary Fig. 5). However, in contrast to NF-κB inhibitors, SB203580 failed to mitigate the increase in CXCL8 expression levels in macrophages. Taken together, these results suggest that ORM2 can increase the production of proinflammatory cytokines via the NF-κB and/or p38 MAP kinase pathway in RA-FLSs and macrophages.
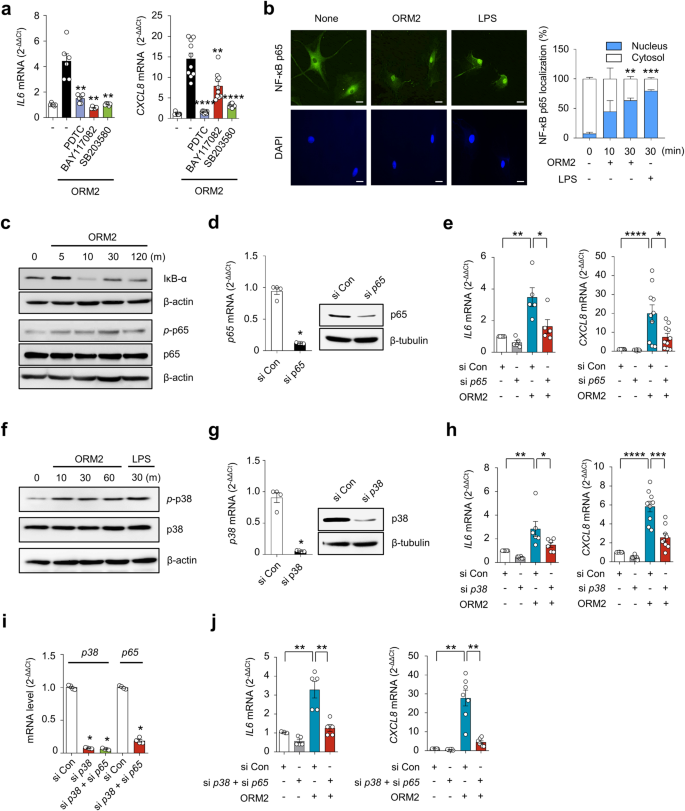
a Effect of NF-κB and p38 MAP kinase inhibitors on ORM2-stimulated IL6 and CXCL8 expression. RA-FLSs were pretreated with PDTC (10 μM), BAY 117082 (40 μM), or SB203580 (10 μM) for 1 h and then stimulated with recombinant ORM2 (1 μg/mL) for 6 h. IL6 and CXCL8 mRNA levels were assessed by qRT‒PCR. The data are presented as the mean ± SEM of more than three independent experiments. **P < 0.01 and ****P < 0.0001 versus ORM2 according to the Kruskal–Wallis test (IL6: P < 0.0001, CXCL8: P < 0.0001) with post hoc pairwise comparisons test using the Mann–Whitney U test. b Immunocytochemistry analysis of NF-κB p65 in RA-FLSs. Cells were activated with ORM2 (1 μg/mL) or LPS (100 ng/mL) for the indicated times. Representative confocal images of p65 translocation to the nucleus are presented. The extent of nuclear translocation (%) was manually counted and is presented in the bar graph. The data are presented as the mean ± SEM of more than three independent experiments. **P < 0.01 and ***P < 0.001 versus no ORM2 according to two-way ANOVA (P < 0.0001) with Sadik’s multiple comparisons. Scale bar: 20 μm. c Western blot analysis of IκB-α, NF-κB phospho-p65 (p-p65), and NF-κB p65 in RA-FLSs stimulated with ORM2 for the indicated times (minutes [m]). d, e Decrease in ORM2-induced IL6 and CXCL8 mRNA levels induced by knockdown of NF-κB p65. RA-FLSs were transfected with NF-κB p65 siRNAs (si-p65, 50 nM) or control siRNAs (si Con, 50 nM) for 24 h. NF-κB p65 expression was determined by qRT‒PCR (left in d) and Western blot analysis (right in d). IL6 and CXCL8 expression levels were determined by qRT‒PCR (e). f Total p38 and phospho-p38 (p-p38) expression levels in RA-FLSs determined by Western blotting after stimulation with ORM2 for the indicated times (minutes). g Downregulation of p38 expression after 24 h of transfection with p38 siRNAs (si p38, 50 nM), as determined by qRT‒PCR (left) and Western blot analysis (right). h qRT‒PCR analysis of IL6 and CXCL8 expression. i NF-κB p65 and p38 expression in double-knockdown cells was analyzed via qRT‒PCR. After p38 transcripts were knocked down for 24 h, RA-FLSs (n = 6) were transfected again with si-p65 for an additional 24 h. j qRT‒PCR analysis of IL6 and CXCL8 expression. The qRT‒PCR data in (e), (h), and (j) were obtained for the siRNA-transfected RA-FLSs (n = 5) 6 h after stimulation with ORM2 (1 μg/mL). The Western blot data in (c), (d), (f), and (g) are representative of three independent experiments. The bar graphs represent the mean ± SEM. *P < 0.05, **P < 0.01, ***P < 0.001, and ****P < 0.0001 according to the Mann‒Whitney U test for (d) and (g); one-way ANOVA (IL6 in (e): P = 0.0003; IL6 in (h): P = 0.0004) with Tukey’s multiple comparisons test; Kruskal‒Wallis test (CXCL8 in (e): P < 0.0001; CXCL8 in (h): P < 0.0001; p38 in (i): P = 0.0002; and IL6 in (j): P = 0.001) with post hoc pairwise comparisons test using a Mann‒Whitney U test; and Brown-Forsythe and Welch ANOVA (P < 0.0001) with Dunnett T3 multiple-comparison test for CXCL8 in (j).
In support of this, recombinant human ORM2 (1 μg/mL) time-dependently increased NF-κB translocation from the cytoplasm to the nucleus in RA-FLSs and upregulated the phosphorylation of NF-κB p65 (Fig. 3b, c), while it downregulated IκB expression up to 2 h after stimulation (Fig. 3c). Moreover, NF-κB p65 siRNA, but not control siRNA, markedly repressed the upregulation of IL6 and CXCL8 mRNA expression induced by ORM2 (Fig. 3d, e), indicating that NF-κB was a major signaling factor involved in this process. Moreover, as early as 10 min following stimulation with recombinant ORM2, phospho-p38 (p-p38) MAP kinase expression was sharply upregulated in RA-FLSs, as determined by Western blot analysis. This increase lasted for 1 h (Fig. 3f). Like NF-κB p65 siRNA, p38 siRNA also strongly inhibited the ORM2-induced increase in IL6 and CXCL8 mRNA levels (Fig. 3g, h), demonstrating that p38 MAP kinase is another major signaling molecule that mediates the promotive effect of ORM2 on IL-6 and CXCL8 expression levels in RA-FLSs. Notably, knockdown of either the NF-κB p65 or p38 MAP kinase transcript only partially reduced the ORM2-stimulated mRNA expression of the IL6 and CXCL8 (Fig. 3e, h). However, simultaneous knockdown of NF-κB p65 and p38 MAP kinase almost completely abolished the ORM2-induced increase in the mRNA expression levels of IL6 and CXCL8 (Fig. 3i, j), suggesting that both the NF-κB p65 and p38 MAP kinase signaling pathways are required for ORM2-induced IL-6 and CXCL8 production by RA-FLSs.
Glycophorin C is a receptor for ORM2 on synovial macrophages and FLSs
Given the ORM2-induced increase in proinflammatory factors in monocytes/macrophages and RA-FLSs (Figs. 2, 3), we next questioned whether a cell surface receptor(s) for ORM2 was present in these cells. If so, what receptor could induce cytokine and chemokine production upon ORM2 ligation? To the best of our knowledge, the specific cellular receptor of ORM2 has not been identified. To address this issue, we first utilized previously published protein-to-protein interactome databases (Supplementary Table 2). With these databases, 11 proteins were found to potentially interact with ORM2. Among these 11 proteins, GYPC has been reported to exhibit receptor activity in erythrocytes29. Therefore, we next explored whether RA-FLSs and macrophages expressed GYPC. As shown in Supplementary Fig. 6a, GYPC was expressed on peripheral monocytes freshly isolated from healthy donors, as determined by flow cytometry. Notably, the expression of this gene was significantly upregulated by stimulation with IL-1β, TNF-α, or LPS; in fact, a large portion of cultured monocytes (more than 80%) expressed GYPC on their surface (Supplementary Fig. 6a, b). In cultured macrophages differentiated from peripheral monocytes, TNF-α and LPS also significantly upregulated GYPC expression on the surface (Fig. 4a). However, IL-6 stimulation failed to upregulate GYPC expression in macrophages (Fig. 4a).
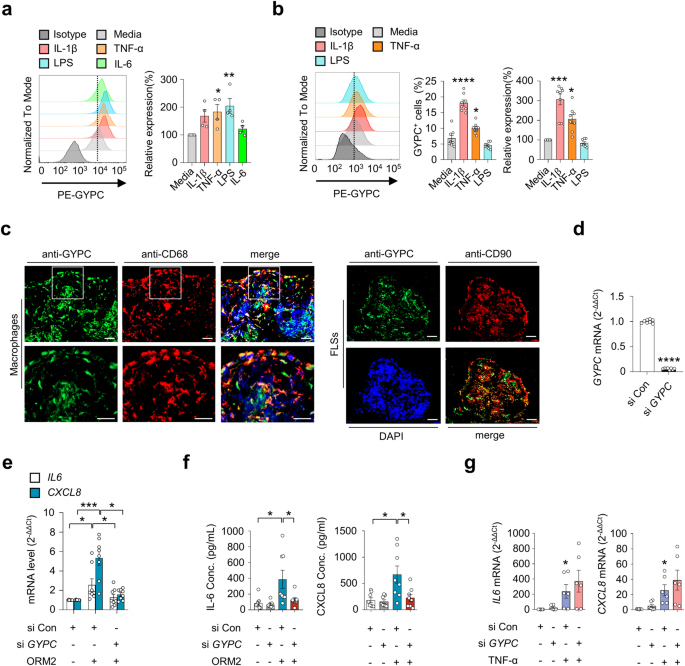
a Flow cytometry analysis of the effect of glycophorin C (GYPC) on macrophages. CD14+ monocytes were isolated from healthy donors (n = 4) and differentiated into macrophages by treatment with M-CSF (20 ng/mL) for 3 days. The cells were then cultured in the absence or presence of IL-1β (10 ng/mL), TNF-α (10 ng/mL), LPS (100 ng/mL), or IL-6 (10 ng/mL) for 24 h. A representative plot is shown in the left panel. The data are presented as the mean ± SEM. *P < 0.05, **P < 0.001 versus media alone according to one-way ANOVA (P = 0.01) with Dunnett’s multiple comparisons test. b Flow cytometry analysis of GYPC on RA-FLSs. RA-FLSs (n = 4) were stimulated with media alone, IL-1β (10 ng/mL), TNF-α (10 ng/mL), or LPS (100 ng/mL) for 48 h. A representative plot is shown in the left panel. The data are presented as the mean ± SEM. *P < 0.05, ***P < 0.001, and ****P < 0.0001 versus media alone according to one-way ANOVA (P < 0.0001) with Tukey’s multiple comparisons test for GYPC+ cells and the Kruskal–Wallis test (P < 0.0001) with Dunn’s multiple comparisons test for relative expression of GYPC. c Double immunofluorescence staining of an RA synovium using antibodies against GYPC, CD68, and CD90. The rectangular area in the top panel is magnified to the bottom panel. Scale bars: 50 μm. For additional immunofluorescence staining data, see Supplementary Fig. 7. d Knockdown of GYPC in RA-FLSs. Cells were transfected with GYPC siRNAs (si GYPC) for 24 h and subjected to qRT‒PCR. e Decrease in ORM2-induced IL6 and CXCL8 mRNA expression in RA-FLSs by GYPC knockdown. RA-FLSs were transfected with si GYPC or si Con for 24 h, stimulated with ORM2 (1 μg/mL) for 6 h, and then subjected to qRT‒PCR to measure IL6 and CXCL8 mRNA expression. f GYPC siRNA reduced IL-6 and CXCL8 secretion by RA-FLSs. The cells were transfected with si GYPC or si Con for 24 h and then stimulated with ORM2 for 72 h. The IL-6 and CXCL8 concentrations (Conc.) in the culture supernatants were measured via ELISA. g No effects of si GYPC on TNF-α-induced IL6 and CXCL8 mRNA expression was not detected via qRT‒PCR. RA–FLSs were transfected with si GYPC for 24 h and then stimulated with TNF-α (10 ng/mL) for 6 h. The bar graphs show the mean ± SEM of more than three independent experiments. *P < 0.05, **P < 0.01, ***P < 0.001, and ****P < 0.0001 according to Welch’s t test for (d) and the Kruskal–Wallis test (IL6 in (e): P = 0.0159, CXCL8 in (e): P = 0.0005; IL-6 in (f): P = 0.0022; CXCL8 in (f): P = 0.0182; IL6 in (g): P = 0.0035; and CXCL8 in (g): P = 0.0023) with Dunn’s multiple comparisons test for (e) and (g) or with post hoc pairwise comparisons test using a Mann–Whitney U test for (f).
GYPC was also expressed in RA-FLSs, but its level was much lower than that in cultured monocytes (Fig. 4b). Like in peripheral monocytes, IL-1β and TNF-α, but not LPS or IL-6, upregulated GYPC expression in RA-FLSs (Fig. 4b and Supplementary Fig. 6c). RA-FLSs exhibit heterogeneity and consist of more than three different subtypes, including CD90+ and CD55+ FLSs30. In particular, CD55+ FLSs, located in the synovial lining, are involved in bone and cartilage damage and have a limited impact on inflammation, while CD90+ fibroblasts in the sublining layer induce more severe inflammation with minimal effects on bone and cartilage30. Immunofluorescence staining of RA synovial tissues revealed that GYPC-expressing cells colocalized well with CD68+ and CD90+ cells, indicating that synovial macrophages and sublining CD90+ FLSs are the major cell types that express GYPC (Fig. 4c and Supplementary Fig. 7). In contrast, only a modest percentage of the CD55+ cells in the lining layer expressed GYPC (Supplementary Fig. 7), suggesting that these cells are not the major FLS subtype that responds to GYPC stimulation. Furthermore, the colocalization of GYPC with macrophage or FLS markers varied (Supplementary Fig. 7), which might be due to the difference in GYPC expression levels depending on proinflammatory stimuli (Fig. 4a, b).
To test whether GYPC could actually mediate ORM2-induced IL-6 and CXCL8 expression, we further carried out knockdown experiments using GYPC siRNA. As a result, GYPC siRNA, but not the control siRNA, almost completely blocked the ORM2-induced increase in IL6 and CXCL8 mRNA expression in RA-FLSs (Fig. 4d, e). Secretion of IL-6 and CXCL8 from RA-FLSs in the presence of recombinant human ORM2 was also markedly hampered by GYPC siRNA (Fig. 4f). In contrast, TNF-α-induced IL6, and CXCL8 expression was rarely affected by GYPC siRNA, which excluded the possibility of nonspecific cellular toxicity caused by GYPC siRNA (Fig. 4g). Collectively, these results strongly suggest that GYPC can function as an ORM2 receptor in RA-FLSs.
To test this hypothesis, we first conducted a proximity ligation assay (PLA) using anti-ORM2 and anti-GYPC antibodies. PLA is a powerful experimental tool that facilitates the detection of protein interactions in situ with high specificity and sensitivity31. Robust red fluorescence was observed only when these two antibodies were simultaneously used to treat RA-FLSs in the presence of recombinant ORM2. Indeed, almost all of the observed RA-FLSs exhibited strong fluorescent signals (see Materials and Methods for details) (Fig. 5a). Such robust red fluorescence was not observed after a single treatment with either the anti-ORM2 or the anti-GYPC Ab. Moreover, in the absence of recombinant ORM2, although fluorescent signals were noted, their intensity was relatively modest (Supplementary Fig. 8, bottom panel). These findings demonstrated that there may be direct molecular interactions between exogenous ORM2 and GYPC on RA-FLSs. To confirm this, solid-phase ELISA was performed using recombinant GYPC (rGYPC) and recombinant ORM2 (rORM2), in which rGYPC was used to precoat the ELISA plate and rORM2 or bovine serum albumin (BSA) was subsequently added to the plate to react with GYPC. As a result, we observed a dose-dependent increase in optical density with increasing concentrations of rORM2, which was not observed with BSA (Fig. 5b). The optical density was further enhanced by increasing the amount of rGYPC coating on the plate (Fig. 5b), indicating that there was a direct molecular interaction between rGYPC and rORM2. We finally investigated whether the increase in cytokine and chemokine production induced by ORM2 could be blocked by the soluble form of rGYPC. As shown in Fig. 5c, the ORM2-induced increase in IL-6 and CXCL8 secretion by RA-FLSs was substantially mitigated by rGYPC pretreatment. This reduction was dose dependent. Taken together, these results, along with the flow cytometric analysis of GYPC and the PLA data, suggest that the soluble form of rGYPC interferes with the interaction between exogenous ORM2 and the membrane form of GYPC, which leads to the inhibition of IL-6 and CXCL8 upregulation induced by ORM2.
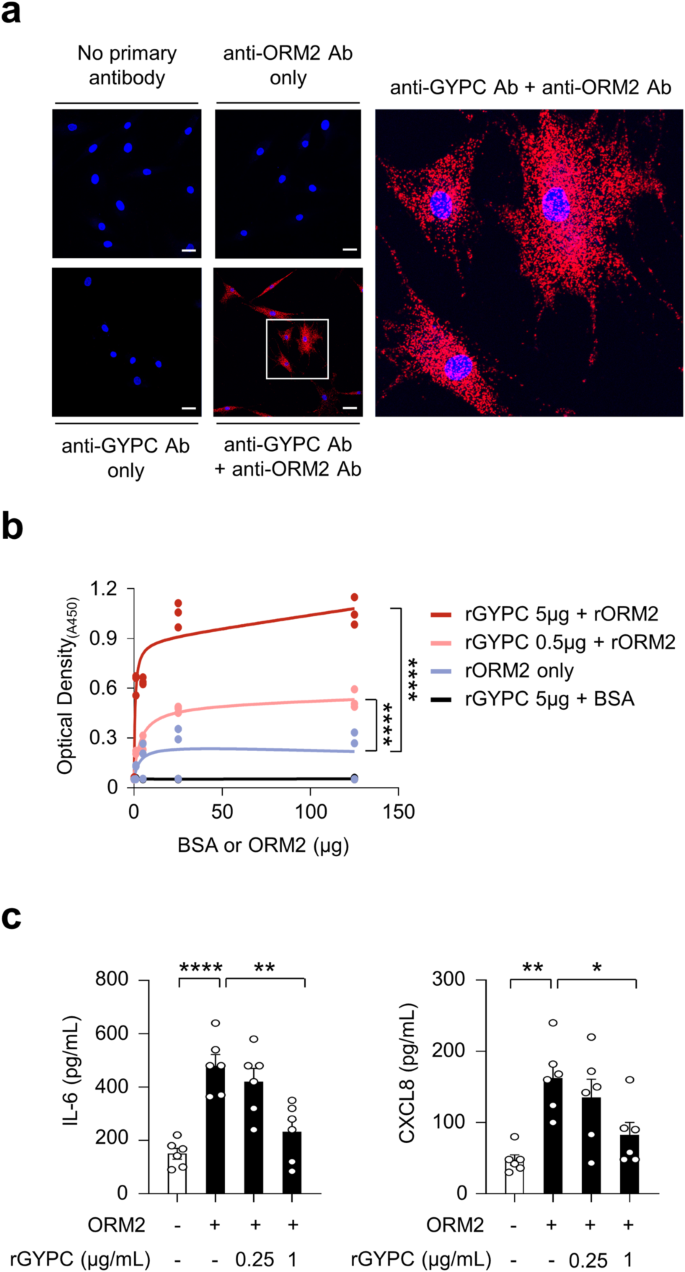
a Proximity ligation assays of RA-FLSs treated with recombinant ORM2 (1 μg/mL). The red fluorescent dots indicate sites at which the ORM2 and GYPC proteins interact on RA-FLSs. The rectangular area in the middle panel (scale bars: 50 μm) is magnified to the right panel (scale bar: 10 μm). b ELISA showing the specific binding of ORM2 to GYPC. The binding plates were coated with recombinant GYPC (rGYPC: 0, 0.5, or 5 μg) and then treated with different amounts (0, 5, 25, or 125 μg) of recombinant ORM2 (rORM2) or bovine serum albumin (BSA). The ‘rORM2 only’ indicates the ELISA results performed with rORM2 at 0, 5, 25, and 125 μg in the absence of the rGYPC coating. c Inhibition of IL-6 and CXCL8 production by the soluble form of GYPC. The cells were pretreated with (soluble) recombinant GYPC (rGYPC: 0.25 and 1 μg/mL) for 1 h and then stimulated with 1 μg/mL recombinant ORM2 (rORM2) for 48 h. IL-6 and CXCL8 levels in the culture supernatants were measured via ELISA. *P < 0.05, **P < 0.01, and ****P < 0.0001. The bar graph in (c) indicates the mean ± SEM of more than three independent experiments; the P values were determined by two-way ANOVA (P < 0.0001) for (b) and one-way ANOVA (IL-6: P < 0.0001; CXCL8: P = 0.0029) with Tukey’s multiple comparisons test for (c).
In summary, GYPC, a membrane glycoprotein required for erythrocyte shaping and stability29, is expressed in synovial macrophages and RA-FLSs. It can interact with ORM2 as a cell surface receptor to mediate the production of proinflammatory cytokines and chemokines.
ORM2 induces proinflammatory cytokine production by mouse macrophages and FLSs
Based on human data, we examined whether the regulation of cytokine/chemokine expression by ORM2 could be reproduced in a mouse model. As shown in Fig. 6a, the mean ORM2 expression was much higher (4.2-fold) in mice with collagen-induced arthritis (CIA), a representative animal model of RA32, than in control (vehicle-treated) mice, as determined by immunohistochemistry and qPCR analysis of synovial tissues (Fig. 6a). Immunofluorescence staining of the affected joints revealed that, similar to what was observed in RA synovium, ORM2 was strongly colocalized with CD55+ and F4/80+ cells in the affected joints of mice with CIA (Fig. 6b and Supplementary Fig. 9), confirming that synovial fibroblasts and macrophages are the major cells that produce ORM2. To validate the regulatory effect of ORM2 on the proinflammatory response in the mouse system, mouse bone marrow-derived macrophages (BMDMs) and synovial fibroblasts isolated from the affected joints of mice with CIA were treated with recombinant mouse ORM2. We found that recombinant mouse ORM2 dramatically increased Tnf and Il6 mRNA expression levels in BMDMs in a time-dependent manner (Fig. 6c). After treatment with 1 μg/mL mouse ORM2 for 6 h, the fold change relative to that in the medium alone was 12.4 for Tnf and 147.9 for Il6 (Fig. 6c). Similarly, compared with FLSs treated with medium alone, ORM2-stimulated mouse FLSs exhibited marked increases in Il6 and Ccl2 expression levels up to 14.5- and 16.0-fold, respectively (Fig. 6c). However, ORM2 stimulation failed to upregulate Il8 expression in mouse FLSs (data not shown), unlike in RA-FLSs. Moreover, ORM2 stimulation substantially increased the secretion of IL-6 and TNF-α in mouse BMDMs and of IL-6 and CCL2 in RA-FLSs in a time-dependent manner (Fig. 6d).
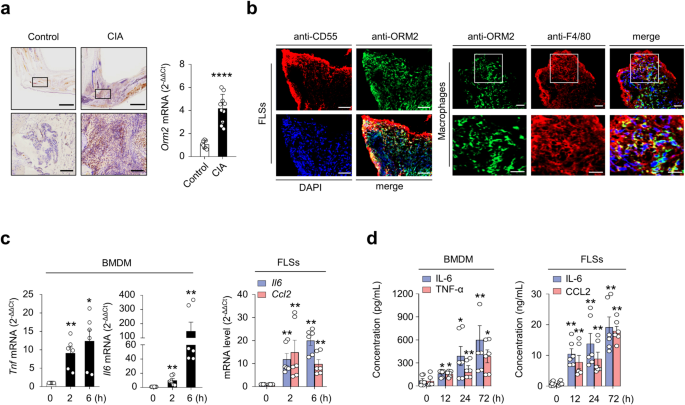
a Upregulated ORM2 expression in the synovial tissues of mice with collagen-induced arthritis (CIA). Mice treated with vehicle alone were used as controls. Left panel: Immunohistochemical staining of arthritic joints from mice with CIA using an anti-ORM2 Ab. The rectangular area in the top panel (scale bars: 1000 μm) is magnified to the bottom panel (scale bars: 200 μm). Right panel: qRT‒PCR analysis of Orm2 expression in the synovia of mice with CIA (n = 10) and control mice (n = 8). The data are presented as the mean ± SD. ****P < 0.0001 versus control mice according to Welch’s t test. b Double immunofluorescence staining of synovial tissues from mice with CIA using an anti-ORM2 Ab, an anti-CD55 Ab (for synovial fibroblasts), and an anti-F4/80 Ab (for synovial macrophages). In the merged images, ORM2+ cells costained with an anti-CD55 Ab or an anti-F4/80 Ab are shown in yellow. The rectangular area in the upper panel is magnified to the lower panel. Scale bars: 50 μm. For additional immunofluorescence staining data, see Supplementary Fig. 9, which includes synovium staining for two other mice with CIA. c ORM2 upregulated Tnf, Il6, and Ccl2 expression in mouse BMDMs and FLSs. The cells were stimulated with mouse ORM2 (1 μg/mL) for 2 or 6 h and then subjected to qRT‒PCR. *P < 0.05 and **P < 0.01 versus untreated cells. d IL-6, TNF-α, and CCL2 secretion by ORM2-stimulated mouse BMDMs and FLSs was determined via ELISA. The cells were stimulated with mouse ORM2 for 12, 24, or 72 h. *P < 0.05 and **P < 0.01 versus untreated cells. The data in (c) and (d) are presented as the mean ± SEM of more than three independent experiments; the P values were calculated by Brown-Forsythe and Welch ANOVA (P = 0.0023) with Dunnett T3 multiple-comparison test for TNF-α secretion by BMDMs in (c) and Kruskal–Wallis test (Il6 by BMDMs in (c): P < 0.0001; Il6 by FLSs in (c): P < 0.0001; Ccl2 by FLSs in (c): P = 0.0005; IL-6 by BMDMs in (d): P = 0.003; TNF-α by BMDMs in (d): P = 0.0081; IL-6 by FLSs in (d): P = 0.0014; and CCL2 by FLSs in (d): P = 0.0004) with post hoc pairwise comparisons test using a Mann–Whitney U test.
Taken together, our results demonstrate that ORM2 is also highly expressed in the inflamed joints of mice, particularly in synovial fibroblasts and macrophages, and directly promotes the secretion of proinflammatory cytokines and chemokines by these cells.
ORM2 promotes IL-1β-induced arthritis in vivo and reflects the inflammatory activity of RA
Since ORM2 has strong proinflammatory activity in vitro, we explored whether ORM2 could aggravate the severity of chronic arthritis in vivo. To this end, we generated a severe form of ORM2-accelerated arthritis by intra-articular administration of ORM2 (4 μg) into the knee joints of mice with suboptimal IL-1β-induced arthritis (Supplementary Fig. 10a), a model of chronic arthritis in which macrophages play a central role33. After inducing IL-1β-induced arthritis in mice, the Orm2 mRNA expression level increased up to 65.3-fold and 3.2-fold in the liver and affected joints, respectively, as determined by qPCR (Fig. 7a). Moreover, compared with vehicle injection, intra-articular injection of ORM2 markedly exacerbated the suboptimal severity of IL-1β-induced arthritis, as assessed by inflammatory cell infiltration and synovial hyperplasia (Fig. 7b). Interestingly, the infiltrated cells were strongly stained with the anti-F4/80 Ab but only modestly stained with the anti-NIMP-R14 Ab (Fig. 7c and Supplementary Fig. 10b). These findings suggest that the major cell types recruited by ORM2 injection are monocytes/macrophages, in accordance with the in vitro findings that ORM2 increases the CCL2 production necessary for monocyte recruitment34, in contrast with the finding that ORM2 has no effect on CXCL8 production for neutrophil recruitment35.
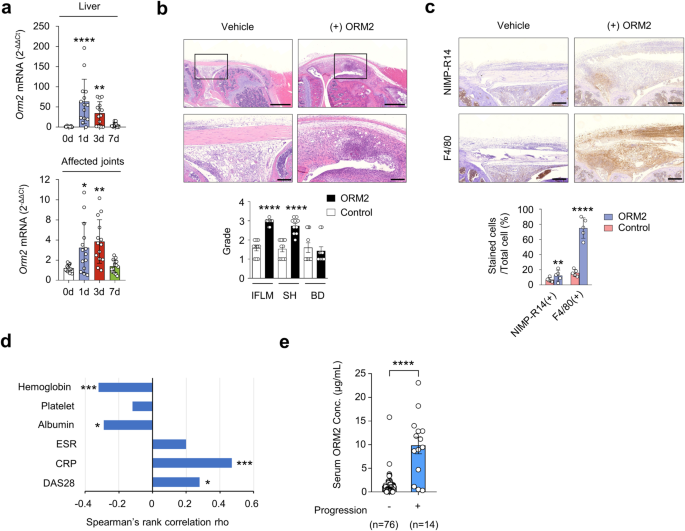
a Dynamic expression of Orm2 in the liver and joints of mice with IL-1β-induced arthritis. After inducing arthritis with IL-1β, the liver (top) and affected joints (bottom) of the mice were harvested on days (d) 0, 1, 3, and 7 and then subjected to qRT‒PCR. The bar graphs represent the mean ± SD. *P < 0.05, **P < 0.01, and ****P < 0.0001 versus Day 0 without arthritis according to the Kruskal–Wallis test (P < 0.0001) with Dunn’s multiple comparisons test for the liver and Brown-Forsythe and Welch ANOVA (P = 0.0003) with the Dunnett T3 multiple-comparison test for the affected joint. b Increased arthritis severity in mice with ORM2-accelerated arthritis (n = 10) compared to mice with IL-1β-induced arthritis only (control mice), as determined by the histological grade of the affected knee joint on Day 7. ORM2-accelerated arthritis was generated by injecting recombinant mouse ORM2 (4 μg) into the ipsilateral knee joint of mice with IL-1β-induced arthritis. IFLM, inflammation; SH, synovial hyperplasia; BD, bone destruction. The rectangular area in the upper panel (scale bars: 1000 μm) is magnified to the bottom panel (scale bars: 200 μm). c Immunohistochemical staining of the affected knee joints of mice with ORM2-accelerated arthritis versus control mice using an anti-NIMP-R14 Ab and an anti-F4/80 Ab. The number of cells positive for each antibody was manually counted. Scale bars: 200 μm. The data are presented as the mean ± SD. ***P < 0.001 and ****P < 0.0001 versus control mice according to the Mann‒Whitney U test for (b) and an unpaired two-tailed t test for (c). d Spearman’s rank correlations of the serum ORM2 concentration with the blood inflammatory marker levels in RA patients. ESR, erythrocyte sedimentation rate; CRP, C-reactive protein; DAS28, Disease Activity Scale with 28-joint assessment. (e) Serum ORM2 concentration (Conc.) according to the radiographic severity of RA. Disease severity was assessed by evaluating radiographic damage via X-rays of the hands and feet, which were taken at baseline and annually thereafter. The statistical analysis in (d) and (e) was performed with Spearman’s correlation coefficient test: *P < 0.05, ***P < 0.001, and ****P < 0.0001.
Finally, we investigated whether the serum ORM2 concentration could represent inflammatory activity and disease severity in RA patients (n = 90) (Supplementary Table 1). The results showed that the serum ORM2 concentration was positively correlated with simultaneously measured parameters for RA activity, including the CRP level (rho = 0.47) and disease activity score 28 (DAS28, rho = 0.28), while it was negatively correlated with the serum ALB concentration (rho = −0.29) and Hb concentration (rho = −0.32) (Fig. 7d). Moreover, serum ORM2 concentrations at baseline were significantly higher in the subgroup of RA patients (n = 14) with radiographic progression than in those without such progression (n = 76), which was determined using the serial X-ray images from patients collected over 2 years (median serum ORM2 levels [IQR]: 10,310 [4,710-12,870] ng/mL for the progression group and 1,090 [340-1,545] ng/mL for the nonprogression group; P < 0.001) (Fig. 7e). Taken together, these results suggest that the serum ORM2 concentration could indicate disease activity and progression in RA patients, suggesting that ORM2 has potential use as a diagnostic marker for RA.


