Elevated level of glycolysis in RA patients and CIA mice
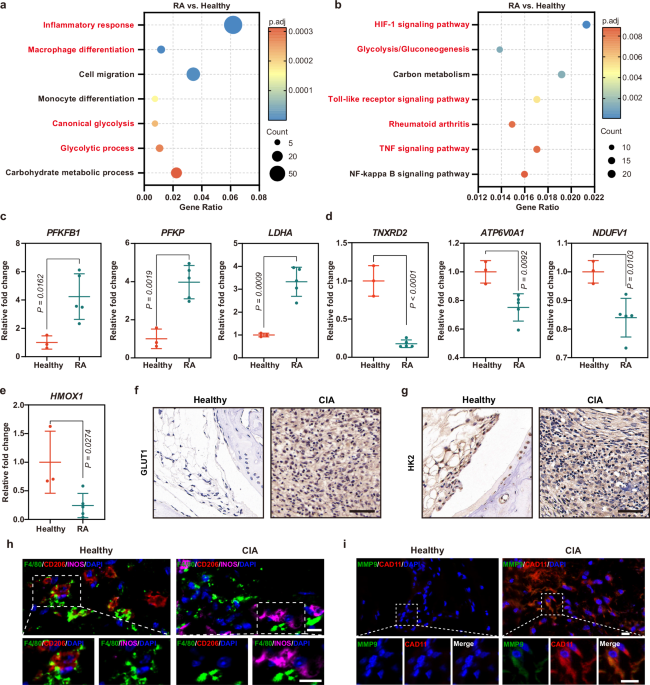
To determine the metabolic status of synovial macrophages in RA patients, RNA sequencing data from GSE10500 was analyzed. As shown in Supplementary Fig. 1a, 939 differentially expressed genes (DEGs) were identified, with 499 upregulated and 440 downregulated ones in RA. Meanwhile, distinct gene expression patterns between healthy individuals and RA patients revealed the existence of altered metabolic profiles (Supplementary Fig. 1b). Subsequently, Gene Ontology (GO) and Kyoto Encyclopedia of Genes and Genomes (KEGG) analysis of these DEGs highlighted the enrichment in glycolytic process, suggesting significant metabolic alterations in RA (Fig. 1a, b). Further, the genes involved in the glycolytic pathway, including PFKPB1, PKFP, LDHA, GAPDH and PKM, were notably upregulated, while the OXPHOS-related genes such as TXNRD2, ATP6V0A1 and NDUFV1 were downregulated (Fig. 1c, d and Supplementary Fig. 2). These findings suggested that enhanced glycolytic flux and reduced OXPHOS activity occurred in RA, leading to metabolic reprogramming of macrophages. Compared with healthy counterparts, the HMOX1 gene expression was significantly reduced in RA (Fig. 1e). Besides the clinical samples, glycolysis markers (GLUT1 and HK2) were significantly elevated in inflamed joints of collagen-induced arthritis (CIA) mice compared to the healthy group, indicating a shift from OXPHOS to glycolysis during the RA progression (Fig. 1f, g and Supplementary Fig. 3). These findings indicated that the elevated glycolysis was a hallmark in both RA patients and CIA mice, playing a crucial role in the pathogenesis of RA.
a, b GO and KEGG enrichment analysis of differentially expressed genes between the synovium macrophages of RA patients and healthy individuals. c Expression of glycolysis-related genes, PFKFB1, PFKP and LDHA in RA patients. d Expression of OXPHOS-related genes, TXNRD2, ATP6V0A1 and NDUFV1 in RA patients. e HMOX1 gene expression in RA patients. f, g Expression level of GLUT1 and HK2 in the arthritic joints of CIA mice detected by immunohistochemistry. Scale bar: 50 μm. h The phenotype of macrophages in the synovial tissues of CIA mice was determined by the immunofluorescence staining of F4/80, CD206 and INOS. Nuclei, blue (DAPI); F4/80, green; CD206, red; INOS, violet. Scale bar: 10 μm. i The FLS phenotype in the synovial tissues of CIA mice was determined by the immunofluorescence staining of CAD11 and MMP9. Nuclei, blue (DAPI); MMP9, green; CAD11, red. Scale bar: 10 μm. a, b The size of the dots denotes the number of genes in this term. The color of the dots is determined by the Benjamini-Hochberg adjusted log10(P values), highlighting the statistical significance of observed variations. Benjamini-Hochberg adjusted P-values are determined by a two-tailed Fisher’s exact test. c–e Data are presented as mean value ± SD, and statistical significance is measured by unpaired two-tailed Student’s t-test. f–i Representative images of three biologically independent experiments with similar results are shown. Source data are provided as Source Data files.
Macrophages in RA exhibited M1 type due to the metabolic shift. As shown in Fig. 1h, compared with the healthy mice, synovial tissues of CIA mice showed lower CD206 expression and higher level of INOS, indicating an abundance of M1 cells in the inflamed joints of CIA mice. The results suggested that M1 macrophages contributed to the inflammatory microenvironment that exacerbated arthritic symptoms. Besides, FLSs in RA exhibited the proliferative phenotype to promote the bone damage and cartilage destruction, characterized by abnormal expression of cadherin-11 (CAD11) and MMP9 (Fig. 1i). Thus, the metabolic shift to glycolysis in CIA mice resulted in the accumulation of M1 macrophages and proliferative FLSs, together leading to an inflammatory microenvironment.
Preparation and characterization of APPC
The synthesis of APPC was conducted by a layer-by-layer approach. Initially, biocompatible polystyrene sulfonate (PSS), serving as an interconnecting layer, was coated on positively-charged AR through electrostatic interaction, forming PSS-coated ARs (AP). Chondroitin sulfate (CS) was reacted with methacrylic anhydride (MAA) to synthesize CSMA, which was then grafted onto PEI25K to synthesize CS-PEI (Supplementary Figs. 4 and 5). Finally, PEI or CS-PEI was coated on AP to construct the delivery systems APP or APPC, respectively (Fig. 2a and Supplementary Fig. 6). As shown in Fig. 2b, c, compared with AR, the size of AP increased and its zeta potential changed from positive to negative state, indicating the successful preparation of AP. In comparison to AP, the size of APP and APPC increased, and the negative zeta potential shifted to a positive status, confirming the successful coating of PEI and CS-PEI on AP. The APPC carrier exhibited favorable stability at pH 7.4, displaying constant hydrodynamic diameter and zeta potential values for 24 h (Supplementary Fig. 7). Moreover, transmission electron microscope (TEM) images revealed that AR exhibited a stable and homogeneous morphology with a length-to-diameter ratio of approximately 4:1, with an absorbance at 808 nm for LSPR effect (Fig. 2d). The high-resolution TEM (HRTEM) of AR showed a lattice spacing of 0.235 nm, implying the growth direction of AR along the (110) crystal plane. APP and APPC retained a similar morphology to AR, indicating that the coating of PEI or CS-PEI did not affect the structural integrity and might preserve the LSPR effect. As shown in Fig. 2e, the maximum absorption peaks of APP and APPC were observed at 520 and 808 nm, which remained unchanged in comparison to AR, suggesting that the assembly of PEI and CS-PEI on AR potentially retained the identical LSPR effect to AR. This hypothesis was further confirmed by NIR irradiation (Fig. 2f). The temperature of PBS remained unchanged, while the temperature of AR, APP and APPC increased under NIR irradiation, confirming their favorable photothermal conversion by LSPR effect. The photothermal conversion efficiencies of APP and APPC were calculated to be 18.66% and 15.91%, respectively. Further, the temperature of APPC increased with the improved NIR irradiation intensity and APPC concentration (Fig. 2g, h, and Supplementary Fig. 8a), and APPC showed consistent temperature changes over four cycles of heating and cooling, indicating its stable photothermal conversion ability (Supplementary Fig. 8b). In summary, these data demonstrated that APPC maintained favorable photothermal conversion capacity and stability.
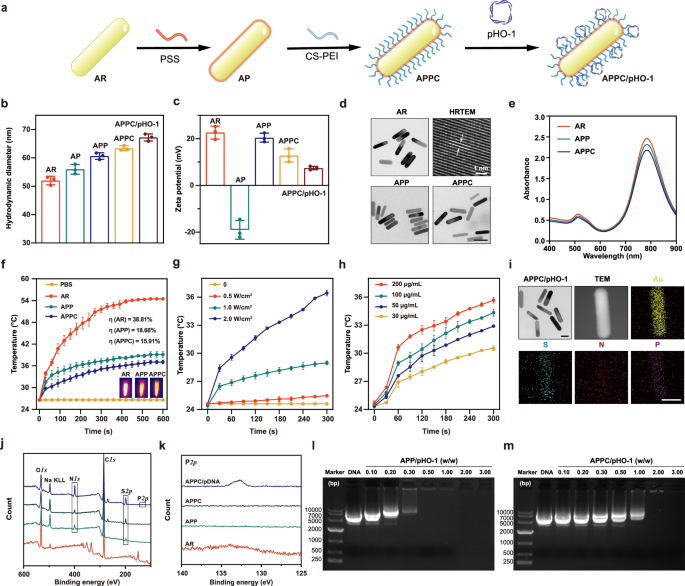
a Synthetic route of APPC. b, c Hydrodynamic diameter and zeta potential of AR, APP, APPC and APPC/pHO-1, respectively. d TEM images of AR, APP and APPC. Scale bar: 50 nm. e UV-vis absorption spectra of AR, APP and APPC. f Temperature change curves of PBS, AR, APP and APPC under NIR irradiation (2.0 W/cm2) over time. g Temperature change curves of APPC (200 μg/mL) under various NIR radiation intensities. h Temperature change curves of different APPC concentrations under NIR irradiation (2.0 W/cm2) over time. i TEM and EDS mapping of APPC/pHO-1 nanoparticles. Scale bar: 25 nm. j, k XPS spectra of AR, APP, APPC and APPC/pHO-1. (l, m) The binding and condensation ability of APP and APPC with pHO-1 at different w/w ratios. Data are presented as mean value ± SD (b, c, f–h, n = 3 independent experiments). i, l, m Representative images of three biologically independent experiments with similar results are shown. Source data are provided as Source Data files.
Next, the DNA-binding ability of APPC was investigated. As shown in Fig. 2i, the APPC/pHO-1 nanoparticles exhibited similar morphology to APPC. The energy-dispersive X-ray spectroscopy (EDS) mapping demonstrated that uniform distribution of S, N and P elements overlapped with Au element. The S element originated from the intermediate PSS layer, and the N and P elements were attributed to PEI layer and plasmid DNA, respectively, indicating that APPC could assemble the pHO-1 plasmid into stable nanoparticles. The X-ray photoelectron spectroscopy (XPS) was conducted for the further elemental analysis of AR, APP and APPC (Fig. 2j). The binding energy at 205.1 eV was attributed to the S element from PSS, and the binding energy at 398.4 eV corresponded to the N element from PEI. The results also confirmed the successful preparation of APP and APPC. As shown in Fig. 2k, a characteristic peak at 130.6 eV, corresponding to P 2p, was found in APPC/pHO-1 but absent in AR, APP and APPC, confirming that APPC could successfully achieve the loading of pHO-1 plasmid. Compared with APPC, the size of APPC/pHO-1 slightly increased, whereas the zeta potential decreased owing to the complexation of APPC with negatively charged pHO-1. To verify the DNA binding performance, APP and APPC were incubated with pHO-1 at different weight-to-weight (w/w) ratios, and gel retardation assay demonstrated that both APP and APPC could form stable nanoparticles with the plasmid (Fig. 2l, m). Though the introduction of CS decreased the positive charge of carrier, APPC could efficiently condense the pHO-1 plasmid to form nanoparticles for transfection. Finally, the stability of APPC/pHO-1 nanoparticles was systematically evaluated. As illustrated in Supplementary Fig. 9a and b, the APPC/pHO-1 nanoparticles possessed favorable stability in physiological environment (pH of 7.4) with constant hydrodynamic diameter and zeta potential values. In parallel, the nanoparticles remained stable after the treatment with 10% and 50% serum (Supplementary Fig. 9c), and exhibited the protection of nucleic acids from the degradation by DNase I (Supplementary Fig. 9d), which provided a basis for the intracellular transfection.
In vitro transfection efficiency and targeting capability of APPC
To investigate the cytotoxicity of APP and APPC, MTT assay was performed in macrophage RAW264.7 and FLSs. As shown in Supplementary Fig. 10a and b, both APP and APPC showed low cytotoxicity with over 90% cell viability at concentrations below 10 μg/mL. Particularly, APPC exhibited lower cytotoxicity than APP at identical concentrations since the introduction of CS reduced the exposure of amino groups. Similar results were observed in FLSs (Supplementary Fig. 10c and d). Subsequently, bio-TEM analysis was performed to directly visualize the endocytosis of APP and APPC in lipopolysaccharide (LPS)-stimulated RAW264.7 cells. Both APPC and APP could be observed in the cytosol, confirming their potential in photothermal conversion in the cytosol (Fig. 3a and Supplementary Fig. 11). Next, the in vitro transfection efficiency of APP and APPC was evaluated in LPS-stimulated RAW264.7 cells at different weight ratios using pEGFP-N3 plasmid as a model (Fig. 3b and Supplementary Fig. 12). The cells treated with APP/pEGFP-N3 and APPC/pEGFP-N3 exhibited clear green fluorescence, and the optimal transfection efficiency for APP was observed at a weight ratio of 4.0. Besides, APP exhibited no fluorescence signals at a weight ratio of 20.0 due to the excessive cytotoxicity. In contrast, APPC showed increasing transfection efficiency at higher weight ratios, and the transfection efficiency of APPC at a weight ratio of 8.0 was comparable to PEI/pEGFP-N3. These findings indicated that APPC could effectively mediate the transfection of plasmid and outperform APP at higher weight ratios. To further investigate whether APPC could trigger the gene expression by NIR irradiation, the cells were transfected with the pHO-1 plasmid containing HSP70 promoter (Supplementary Fig. 13a). The ROS production under NIR irradiation was first monitored to determine the potential cytotoxic effect (Supplementary Fig. 14). Clearly, APPC did not induce the ROS production under NIR irradiation at 0.5 and 1.0 W/cm2 for 15 min, whereas increased ROS production was observed at NIR intensity of 2.0 W/cm2 for more than 5 min. This effect was probably caused by the excessive heat generated by APPC, leading to the undesirable side effect of ROS. Thus, NIR irradiation at 2.0 W/cm2 for 5 min was selected as the optimal conditions to induce the gene expression. Considering that the introduction of HSP70 promoter might yield cytotoxicity from the expression of HSP70, its protein level was detected by western blotting. As indicated in Supplementary Fig. 15, the LPS stimulation caused a significant increase in the cellular HSP70 protein, which was a protective mechanism that could promote the shift in cellular glycolysis44. Simultaneously, the heat generated by APPC under NIR did not induce a further increase of HSP70 level, confirming that the photothermal conversion of APPC carrier did not produce cytotoxicity. The HSP70 expression was observed to be decreased after the treatment with APPC/pHO-1 nanoparticles under NIR irradiation, which was caused by the shift in OXPHOS mediated by the HO-1 expression. Thus, the introduction of HSP70 promoter did not cause cytotoxicity. The Hmox1 mRNA level significantly increased under 42 °C, confirming the thermal activation of HSP70 promoter (Supplementary Fig. 16). In contrast, no significant mRNA elevation was detected at 37 °C, indicating low leakage of HSP70 promoter. Both APP and APPC enhanced the Hmox1 mRNA level under NIR irradiation, demonstrating that their LSPR effect could produce enough heat to activate the HSP70 promoter. Following NIR irradiation, the optimal weight ratios for transfection were identified as 4.0 for APP and 8.0 for APPC, respectively. Further, the APPC/pHO-1 nanoparticles could induce the stable Hmox1 expression after 48 h under NIR irradiation, and the level could be maintained for at least 24 h (Supplementary Fig. 17a). When the Hmox1 level reached the plateau after the first NIR irradiation, the level could be further improved by the secondary NIR irradiation, confirming the multiple inducibility of HSP70 promoter (Supplementary Fig. 17b).
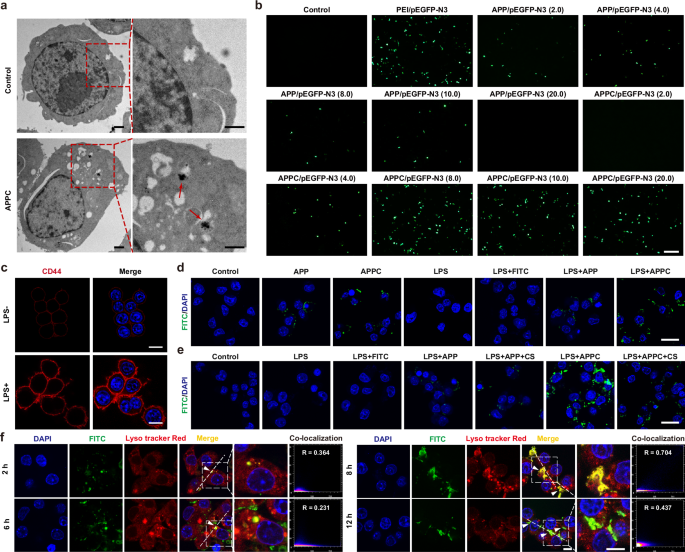
a Bio-TEM images of RAW264.7 cells after the transfection of APPC/pHO-1 nanoparticles. The red arrows indicated the presence of APPC in the cytoplasm. Scale bar: 1 μm. b Fluorescence images of LPS-stimulated RAW264.7 cells after the transfection of APP/pEGFP-N3 and APPC/pEGFP-N3 for 48 h. Scale bar: 200 μm. c The CD44 expression in normal and LPS-stimulated RAW264.7 cells. Nuclei, blue (DAPI); CD44, red. Scale bar: 10 μm. d Endocytosis of APP and APPC in normal and LPS-stimulated RAW264.7 cells. Nuclei, blue (DAPI); APP or APPC, green (FITC). Scale bar: 20 μm. e Endocytosis of APP and APPC in LPS-stimulated RAW264.7 cells after the CS shielding. Nuclei, blue (DAPI); APP or APPC, green (FITC). Scale bar: 20 μm. f Intracellular biodistribution of APPC/pHO-1 in LPS-stimulated RAW264.7 cells. Nuclei, blue (DAPI); APPC, green (FITC); lysosomes, red (Lyso Tracker Red). The white arrows represented the overlap of green and red fluorescence, indicating that the nanoparticles were entrapped in endosomes. Scale bar: 10 μm. a–f Representative images of three biologically independent experiments with similar results are shown.
CD44 receptor is highly expressed on the surface of synoviocytes in RA45,46, and thus the intracellular distribution of APPC was investigated. As shown in Fig. 3c, CD44 expression of macrophages was significantly elevated upon LPS stimulation. To further evaluate the targeting ability, APP and APPC was labeled with fluorescein isothiocyanate (FITC). In LPS-stimulated RAW264.7 cells, APPC demonstrated higher internalization than APP due to the introduction of targeting ligand CS (Fig. 3d). Additionally, APPC exhibited greater cellular uptake in the LPS-stimulated cells compared to unstimulated conditions, attributing to the elevated expression of CD44 in inflammatory macrophages. However, there were no obvious differences in the endocytosis of APP between these two conditions owing to the lack of CS modification. To further confirm that the cellular uptake of APPC was relied on the CD44-dependent endocytosis, CD44 receptor was shielded by the incubation of CS with LPS-stimulated macrophages. The endocytosis of APPC significantly decreased after the shielding of CD44 on the cell membrane, while the cellular uptake behavior of APP remained unchanged (Fig. 3e). In addition, the FITC-labeled APPC/pHO-1 nanoparticles could be successfully internalized into cells with uptake efficiency of 65% (Supplementary Fig. 18), whereas low temperature completely inhibited the cellular uptake, implying that the endocytosis of APPC/pHO-1 nanoparticles was performed in an energy-dependent manner. Concurrently, the cellular uptake significantly decreased in the cells pretreated with chlorpromazine, suggesting that the internalization of APPC/pHO-1 nanoparticles was mainly dependent on the clathrin-mediated endocytosis. In a word, APPC/pHO-1 nanoparticles entered the cells primarily through the CD44-dependent and clathrin-mediated endocytosis. The intracellular distribution of APPC was analyzed through confocal laser scanning microscopy (CLSM). In the LPS-stimulated macrophages, APPC/pHO-1 could be internalized within the first 2 h, and subsequently located in the endosomes for 8 h, while the endosomal escape of APPC/pHO-1 was achieved after 12 h due to the “proton sponge” effect of PEI (Fig. 3f and Supplementary Fig. 19). Similar results were achieved in the TNF-α-stimulated FLSs (Supplementary Fig. 20). Overall, APPC could target both inflammatory macrophages and proliferative FLSs to effectively mediate the pHO-1 transfection, which was crucial for the subsequent therapeutic response.
Metabolic reprogramming of macrophages by APPC/pHO-1 nanoparticles
To determine the role of HO-1 in macrophages, the intracellular HO-1 expression was measured by western blotting and qPCR. As displayed in Fig. 4a and Supplementary Fig. 21a, the HO-1 expression slightly increased after the LPS stimulation compared to the control, demonstrating its role as a stress protein activated for the cellular protection. Transfection with APPC alone did not alter the HO-1 expression, whereas both APP- and APPC-mediated transfection of pHO-1 elevated the HO-1 level under NIR irradiation. This activation was caused by the photothermal conversion driven by LSPR effect, initiating the transcription of Hmox1 gene via HSP70 promoter. In the absence of NIR irradiation, the elevated HO-1 expression could not be observed, indicating that the photothermal effect was essential to induce the expression of Hmox1 gene. Particularly, in comparison to APP/pHO-1, the APPC/pHO-1 transfection resulted in significantly higher HO-1 level owing to the enhanced targeting ability of APPC. The results were consistent with qPCR analysis (Supplementary Fig. 21b).
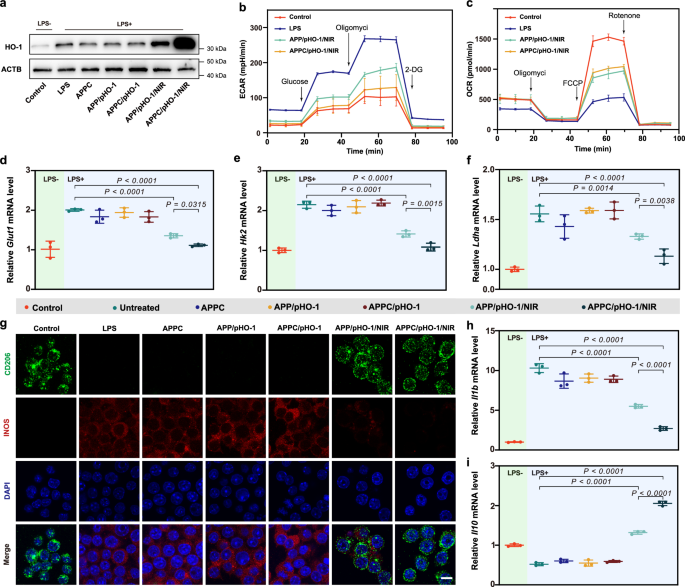
a The expression level of HO-1 in LPS-stimulated RAW264.7 cells after the pHO-1 transfection. Representative blots of three independent experiments with similar results are shown. b, c ECAR and OCR of LPS-stimulated RAW264.7 cells after the pHO-1 transfection. Data are presented as mean ± SD (n = 5 independent samples). d–f Relative mRNA levels of Glut1, Hk2 and Ldha in LPS-stimulated RAW264.7 cells after the pHO-1 transfection. g The macrophage phenotype after the pHO-1 transfection. Nuclei, blue (DAPI); CD206, green; INOS, red. Scale bar: 10 μm. Representative images of three biologically independent experiments with similar results are shown. h, i Relative mRNA levels of Il1b and Il10 in LPS-stimulated RAW264.7 cells after the pHO-1 transfection. LPS- represents the RAW264.7 cells without lipopolysaccharide stimulation, and LPS+ groups represent the RAW264.7 cells treated with lipopolysaccharide (0.1 μg/ml) for 24 h (d–f, h, i). Data are presented as mean ± SD (d–f, h, i, n = 3 independent experiments), and one-way ANOVA with LSD test is used for statistical analysis. Source data are provided as Source Data files.
To explore the metabolic effect of HO-1, extracellular acidification rate (ECAR) and oxygen consumption rate (OCR) were measured to evaluate glycolysis and OXPHOS, respectively (Fig. 4b and Supplementary Fig. 22). The LPS stimulation significantly increased ECAR of macrophages indicating the enhanced cellular glycolysis, and the cells reduced the glycolytic metabolism after the pHO-1 transfection. Notably, APPC/pHO-1 under NIR irradiation showed a greater inhibitory effect on glycolysis than APP/pHO-1. Moreover, the OCR level reflecting the OXPHOS activity, decreased significantly after the LPS stimulation, indicating a shift toward glycolysis (Fig. 4c). The pHO-1 transfection restored the OCR level, with APPC/pHO-1 showing the strongest effect under NIR irradiation. Basal respiration, ATP production and maximal respiration were all reduced after the LPS stimulation, while HO-1 expression promoted the oxygen consumption especially in the APPC/pHO-1 group, suggesting a metabolic shift back to OXPHOS (Supplementary Fig. 23). To further understand the changes in glycolysis, intracellular concentrations of glucose and lactate were examined. As shown in Supplementary Fig. 24a, cytosolic glucose concentration significantly increased after the LPS stimulation, indicating the enhanced glucose transport to initiate glycolysis. The treatment with APPC/pHO-1 under NIR irradiation reduced the intracellular glucose concentration, suggesting that the improved HO-1 level achieved the inhibition of glycolysis. Similarly, the LPS-stimulated macrophages showed an elevated lactate level, a direct byproduct of glycolytic pathway contributing to low pH environment and cellular stress (Supplementary Fig. 24b). Elevated HO-1 expression reduced the intracellular lactate concentration, confirming its role in the inhibition of glycolysis. Moreover, JC-1 staining showed that the mitochondrial membrane potential decreased after the LPS stimulation, implying the mitochondrial damage under inflammatory conditions (Supplementary Fig. 25). In contrast, the treatment with nanoparticles under NIR irradiation restored the mitochondrial membrane potential to facilitate OXPHOS. Further, ATP production, a critical indicator of mitochondrial function and overall cellular metabolic state, was weakened under the glycolysis-driven conditions but significantly increased following the treatment with APPC/pHO-1, suggesting a metabolic shift towards OXPHOS (Supplementary Fig. 26). Besides ATP, reactive oxygen species (ROS) contributed to the oxidative environment in inflamed tissues. As shown in Supplementary Fig. 27, elevated ROS level in LPS-stimulated cells was reduced after the HO-1 expression, thereby protecting mitochondrion against oxidative stress. To further confirm HO-1’s impact on glycolysis, the level of key glycolytic genes was investigated (Fig. 4d–f and Supplementary Fig. 28a). The LPS stimulation upregulated the expression of Glut1 and Ldha, responsible for glucose uptake and lactate production, respectively. Conversely, the pHO-1 transfection suppressed these elevations, with APPC/pHO-1 under NIR irradiation showing the strongest inhibition. Similarly, the rate-limiting enzymes in glycolysis (Hk2 and Pfkp) were inhibited by the HO-1 expression. All these findings demonstrated that the transfection of pHO-1 inhibited the glycolytic enzymes to reduce the glycolysis and enhance the mitochondrial function.
Since cellular metabolism determines the phenotypic differentiation, the markers of macrophage polarization were monitored after the HO-1 expression. As shown in Fig. 4g and Supplementary Fig. 29, the LPS-stimulated macrophages demonstrated elevated INOS and reduced CD206 levels, indicating a shift from M2 to M1 phenotype in inflammation. No significant changes were observed when the cells were treated with APPC alone or without NIR irradiation. Notably, the HO-1 expression led to increased CD206 and decreased INOS levels, thereby achieving the M1-to-M2 shift to disrupt inflammation. Moreover, the LPS stimulation promoted the production of pro-inflammatory factors such as Il6, Il1b and Tnf (Fig. 4h and Supplementary Fig. 28b–d), indicating that the macrophage phenotype influenced the production of cytokines to shape the microenvironment. The pHO-1 transfection significantly reduced the level of these factors, whereas the anti-inflammatory ones (Il10, Il4 and Arg1) were upregulated (Fig. 4i, Supplementary Fig. 28e and f). As anticipated, APPC/pHO-1 showed the most pronounced anti-inflammatory response under NIR irradiation, indicating that the APPC-mediated pHO-1 delivery facilitated the suppression of inflammation. In a word, APPC/pHO-1 could inhibit the glycolysis and facilitate the phenotype shift of macrophages from M1 to M2 to execute the anti-inflammatory function.
Based on the RNA-seq analysis of macrophages, 4298 DEGs have been identified between LPS stimulation and Control groups (Supplementary Fig. 30a). GO enrichment indicated that these DEGs were involved in the regulation of inflammatory response and metabolism following LPS stimulation (Fig. 5a). Gene set enrichment analysis (GSEA) further confirmed that chronic inflammatory response and glucose metabolic process were upregulated after the LPS stimulation, highlighting the relationship of glucose metabolism and macrophage polarization (Fig. 5b). In contrast, 2281 DEGs were identified between APPC/pHO-1 and LPS stimulation, which were enriched in inflammatory pathway, TNF production, activation and migration regulation of macrophages (Supplementary Fig. 30b and Fig. 5c). Further, GSEA indicated the cellular oxidative phosphorylation was upregulated in APPC/pHO-1 group compared to LPS stimulation (Fig. 5d). Regulation of these pathways confirmed that HO-1 could alter the behavior of macrophages and reduce the inflammation, leading to anti-inflammatory response. Further analysis revealed that APPC/pHO-1 inhibited the expression of glycolytic and pro-inflammatory genes, including Pfkfb3, Hkdc1, Itgam, Mmp9 and Mmp13 (Fig. 5e, Supplementary Figs. 31 and 32). Ingenuity pathway analysis (IPA) demonstrated that the pHO-1 delivery could inhibit key signaling pathways, including the PFKFB4 signaling pathway, the macrophage classical activation signaling pathway, as well as the inflammation-associated pathways, confirming HO-1’s role in regulating metabolic and inflammatory processes (Fig. 5f). In addition, the RAW264.7 cells were differentiated into an osteoclast model through the treatment with RANKL and M-CSF to analyze the effect of APPC/pHO-1 nanoparticles on the osteoclast function in RA. As shown in Supplementary Fig. 33b, c, the expression of glycolytic markers Glut1 and Hk2 increased in osteoclasts, which was attributed to the fact that the enhancement of glycolysis could promote the differentiation of osteoclasts, as evidenced by the elevated Acp5 level, an osteoclast marker (Supplementary Fig. 33d). After the transfection of APPC/pHO-1 nanoparticles, an improved expression level of Hmxo1 could be observed in osteoclasts under NIR irradiation (Supplementary Fig. 33a). The HO-1 expression inhibited the glycolytic process, which subsequently inhibited the levels of Acp5, Cathepsin K and Mmp9 in osteoclasts (Supplementary Fig. 33d–f), thereby facilitating the alleviation of bone resorption. In summary, our data demonstrated that the transfection of APPC/pHO-1 effectively inhibited the glycolysis, shifted the macrophage phenotype from M1 to M2, and suppressed the inflammatory responses, highlighting its therapeutic potential in inflammatory diseases (Fig. 5g).
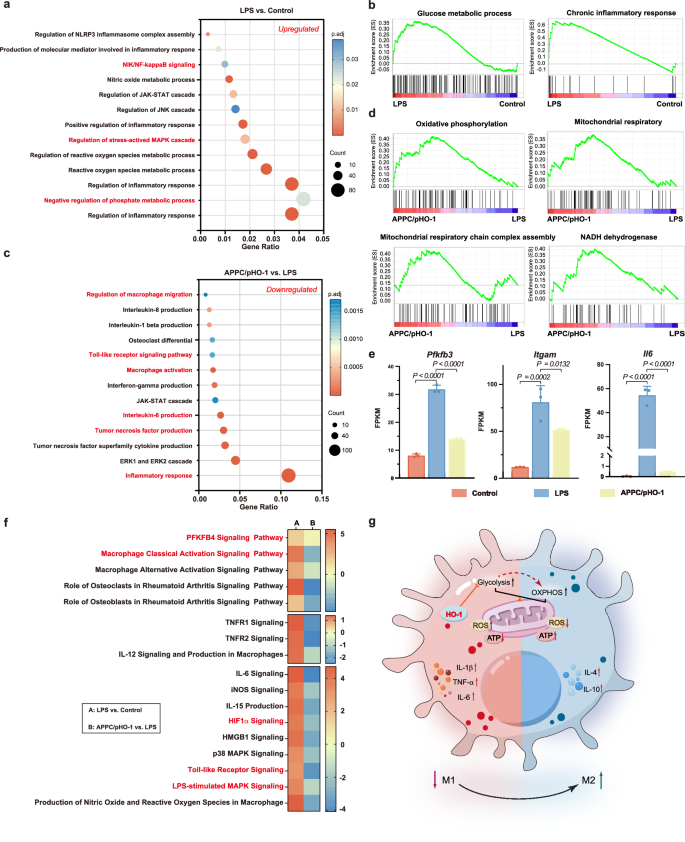
a GO enriched pathways of DEGs between normal (Control) and LPS-stimulated RAW264.7 cells. b Activation of signaling pathways related to glycolysis in LPS-stimulated RAW264.7 cells. c GO enriched pathways of DEGs in LPS-stimulated RAW264.7 cells after the transfection of APPC/pHO-1. d Activation of signaling pathways related to OXPHOS in APPC/pHO-1 group. e Expression of genes related to glycolysis, macrophage polarization and inflammation in LPS-stimulated RAW264.7 cells after the pHO-1 transfection. Data are presented as mean ± SD (n = 3 independent samples), and one-way ANOVA with LSD test is used for statistical analysis. f IPA analysis of cell signaling pathways containing DEGs between two groups, colored by Z-score. A positive Z-score indicated activation, and a negative Z-score indicated inhibition. g Illustration of HO-1’s inhibitory effects on glycolysis and its anti-inflammatory mechanism. a, c The size of the dots represents the number of genes in this term. The sizes of the dots are governed by the Benjamini-Hochberg adjusted-log10(P values), highlighting the statistical significance of observed variations. Benjamini-Hochberg adjusted-P values are obtained by a two-tailed Fisher’s exact test. Source data are provided as Source Data files.
Metabolic reprogramming of FLSs by APPC/pHO-1 nanoparticles
FLSs play a critical role in RA by driving inflammation and joint damage. The TNF-α stimulation slightly induced the HO-1 expression in FLSs as a protective response, and the nanoparticles containing pHO-1 significantly elevated the HO-1 expression under NIR irradiation (Fig. 6a and Supplementary Fig. 34). These results indicated that NIR could trigger the transcription of Hmox1 gene by activating the HSP70 promoter. Meanwhile, the TNF-α stimulation induced the glycolysis in FLSs, as characterized by the elevated level of glycolysis-related genes (Fig. 6b, c, and Supplementary Fig. 35). The HO-1 expression inhibited the levels of these genes, meaning the suppression of cellular glycolysis in FLSs. Moreover, the TNF-α-stimulated FLSs showed reduced mitochondrial membrane potential, indicating the presence of mitochondrial damage (Supplementary Fig. 36). In contrast, the improved HO-1 level restored the mitochondrial membrane potential to mitigate the damage and promote OXPHOS. Further, ATP production, an important indicator of mitochondrial function and cellular metabolic status, was attenuated in response to inflammatory stimuli but increased significantly after the treatment with APPC/pHO-1 nanoparticles, suggesting a metabolic shift toward OXPHOS (Supplementary Fig. 37). Additionally, TNF-α elevated the ROS production in FLSs, and the HO-1 expression reduced the ROS level to relieve the oxidative stress of mitochondria (Supplementary Fig. 38). These findings suggested that HO-1 not only inhibited the glycolysis but also restored the mitochondrial function of FLSs.
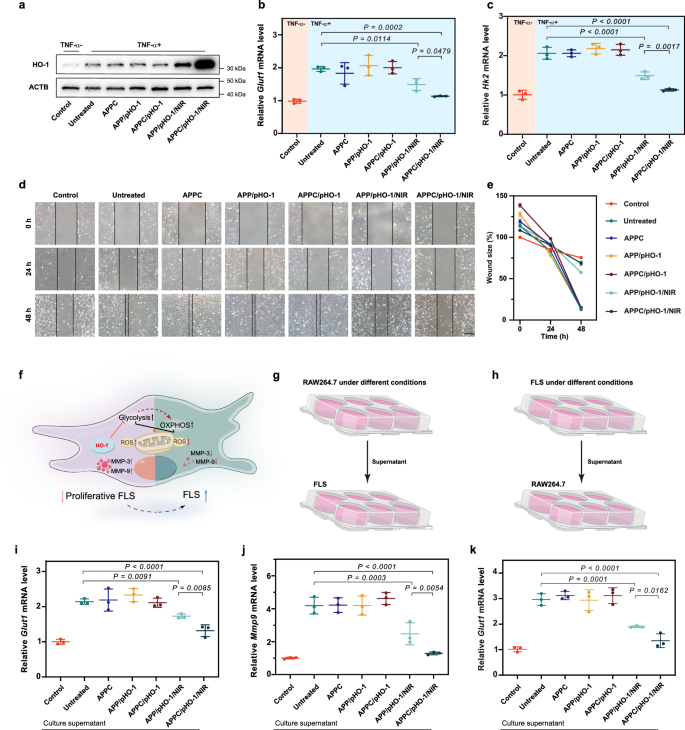
a The expression level of HO-1 in TNF-α-stimulated FLSs after the pHO-1 transfection. Representative blots of three independent experiments with similar results are shown. b, c Relative mRNA levels of Glut1 and Hk2 in TNF-α-stimulated FLSs after the pHO-1 transfection, respectively. TNF-α- represents the FLS cells without TNF-α stimulation, and TNF-α+ groups represent the FLS cells treated with TNF-α (0.1 μg/ml) for 24 h. d Representative images for the wound healing of FLSs under different treatments at 0, 24, and 48 h. Scale bar: 200 μm. Representative images of three biologically independent experiments with similar results are shown. e The statistical quantification of scratch width of FLSs under various treatments at different time. f The illustration of HO-1’s inhibitory effect on the proliferation of FLSs. g Schematic representation of the impact of RAW264.7 cells on the physiology of FLSs. h Schematic representation of the influence of FLSs on RAW264.7 cells. i, j Relative mRNA level of Glut1 and Mmp9 in FLSs after the stimulation with supernatants of RAW264.7 cells under different treatments. k Relative mRNA level of Glut1 in RAW264.7 cells following the stimulation with supernatants from FLSs under various conditions. Data are presented as mean ± SD (b, c, e and i–k, n = 3 independent experiments), and one-way ANOVA with LSD test is used for statistical analysis. Source data are provided as Source Data files.
MTT assay showed that TNF-α significantly enhanced the proliferation of FLSs, while the NIR-triggered HO-1 expression suppressed this effect (Supplementary Fig. 39). Meanwhile, scratch and Transwell assays showed that the improved HO-1 level reduced the migratory and invasive capacity of FLSs, as characterized by decreased wound healing and fewer cells across the membrane (Fig. 6d, e, and Supplementary Fig. 40). In addition, the HO-1 expression inhibited the mRNA levels of Mmp3 and Mmp9 in FLSs, further reducing the invasive phenotype of FLSs (Supplementary Fig. 41). Taken together, the transfection of APPC/pHO-1 under NIR reprogrammed the cellular metabolism by inhibiting the glycolytic process, thereby reversing the typical cellular phenotype and reducing the proliferation, invasion and migration of FLSs (Fig. 6f).
Intercellular interaction of FLSs and macrophages contributes to the microenvironment of RA, driving the inflammation and tissue damage. Supernatants from RAW264.7 cells under different culture conditions were collected to stimulate FLSs (Fig. 6g), which elucidated that the supernatants from LPS-stimulated macrophages improved the expression of glycolysis-related genes, including Glut1, Hk2 and Ldha (Fig. 6i and Supplementary Fig. 42a, b). This alteration indicated that the cytokines produced by macrophages induced the metabolic changes in FLSs, ultimately leading to the elevation of MMP secretion and the exacerbation of inflammatory process (Fig. 6j and Supplementary Fig. 42c). Conversely, the supernatants from APPC/pHO-1/NIR group decreased the expression of these genes, indicating that the HO-1 expression inhibited the glycolysis of macrophages and then reduced the secretion of inflammatory cytokines to activate the invasive FLSs. Similarly, the effect of FLSs on macrophages was investigated using the supernatants from FLSs to stimulate RAW264.7 cells (Fig. 6h). As shown in Fig. 6k and Supplementary Fig. 43, the supernatants from TNF-α-stimulated FLSs promoted the expression of glycolysis-related genes in macrophages, further inducing the inflammatory response. The elevated HO-1 expression in FLSs reduced the production of cytokines, thereby diminishing the induction of inflammatory effect in macrophages. In summary, cytokines produced by macrophages and FLSs perpetuated the mutual activation of these cells in RA, forming a vicious cycle of inflammation; and the HO-1 overexpression disrupted this cycle by blocking the glycolytic process to inhibit the inflammatory phenotype and potentially mitigate the disease progression.
In vivo photothermal conversion capacity of APPC
To verify whether APP and APPC could achieve in vivo photothermal conversion, saline, APP, APPC, APP/pHO-1-mCherry and APPC/pHO-1-mCherry were intramuscularly injected into the hind limbs of C57BL/6 N mice, which were irradiated under 2 W/cm2 NIR for 5 min at 8 h post-administration (Supplementary Fig. 44). The plasmid pHO-1-mCherry with HSP70 promoter was constructed as shown in Supplementary Fig. 13b. Clearly, no temperature changes were observed in the saline group, confirming that NIR alone did not trigger the temperature change (Supplementary Fig. 45a). Nevertheless, the left hind limb in APP and APPC groups showed a significant improvement in temperature after NIR irradiation, indicating favorable photothermal conversion capacity of APP and APPC. Meanwhile, the loading of pHO-1-mCherry did not influence the photothermal conversion capacity of these two carriers (Fig. 7a). Moreover, compared with the absence of NIR irradiation, the red fluorescence of mCherry could be obviously detected in the limbs receiving APP/pHO-1-mCherry and APPC/pHO-1-mCherry under NIR irradiation (Fig. 7b, c, and Supplementary Fig. 45b). In contrast, the administration of nanoparticles without NIR irradiation did not produce red fluorescence, indicating the HSP70 promoter-driven gene expression was tightly regulated and only activated under NIR-induced photothermal conditions.
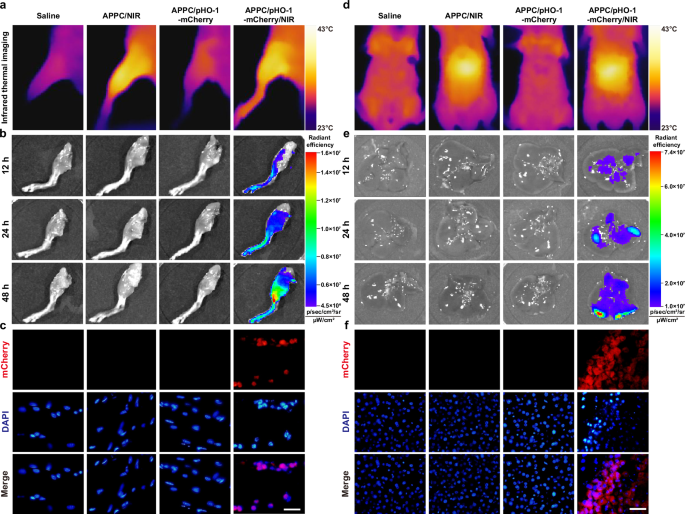
a Representative thermal images of mice limbs after the intramuscular injection of different nanoparticles and subsequent NIR irradiation. b Ex vivo expression of mCherry in muscles of C57BL/6 N mice observed at 12, 24 and 48 h post-administration. c The mCherry expression in irradiated muscles at 48 h post-administration. Nuclei, blue (DAPI); mCherry, red. Scale bar: 20 μm. d Representative thermal images of mice abdomen after the intravenous injection of different nanoparticles and subsequent NIR irradiation at the liver area. e Ex vivo expression of mCherry in the liver of C57BL/6 N mice observed at 12, 24, and 48 h post-administration. f The mCherry expression in the irradiated liver of C57BL/6 N mice at 48 h post-administration. Nuclei, blue (DAPI); mCherry, red. Scale bar: 100 μm. a–f Representative images of three biologically independent animals with similar results are shown.
To further analyze whether NIR irradiation could specifically trigger gene expression in the targeted tissues, the mCherry expression was examined in the liver after the intravenous injection of different nanoparticles (Supplementary Fig. 46). As displayed in Fig. 7d, e, NIR irradiation on the liver area increased the local temperature after the intravenous injection of APPC, indicating that APPC could be accumulated in the liver to trigger the photothermal conversion. Moreover, no mCherry expression could be achieved in the absence of NIR irradiation, and the APPC/pHO-1-mCherry/NIR group showed obvious mCherry fluorescence in the liver (Fig. 7f). All these results suggested that NIR irradiation could elevate the local temperature to trigger the expression of specific genes in the irradiated tissues, which was beneficial to minimize the genetic toxicity by preventing unintended gene expression in non-targeted sites.
In vivo biodistribution of APPC/pHO-1 in CIA mice
The in vivo biodistribution of APPC/pHO-1 nanoparticles was investigated in CIA mice to assess the accumulation at inflamed sites. To visualize the nanoparticles’ distribution after the intravenous injection, the pHO-1 plasmid was labeled with TOTO-3 dye. As shown in Fig. 8a, b and Supplementary Fig. 47, limited fluorescence was observed in the joint tissues for TOTO-3-labeled pHO-1 group due to the rapid metabolism and elimination. In contrast, strong fluorescence could be detected in joint tissues after 1 h post-injection of APP/pHO-1 and APPC/pHO-1. This phenomenon suggested that these two carriers could protect pHO-1 from degradation and enhance its accumulation in inflamed joints based on ELVIS effect. Meanwhile, compared with APP/pHO-1, APPC/pHO-1 showed higher accumulation in the inflamed joints and retained the fluorescent signal for up to 24 h, attributing to the APPC’s targeting ability to inflammatory macrophages and invasive FLSs besides ELVIS effect. Except for the inflamed joints, the nanoparticles were found to be accumulated in the liver, kidney, and lung owing to the capture ability of macrophages in these tissues. In addition, we measured the gold concentrations in different tissues by inductively coupled plasma-mass spectrometry (ICP-MS). No significant differences of gold concentration were detected in major organs between APP and APPC groups, and elevated gold concentration in joints was found in APPC in comparison to APP (Supplementary Fig. 48). These results further supported that APPC could enhance the accumulation of pHO-1 in inflamed tissues through the combination of ELVIS effect and synovial targeting ability of the carrier.
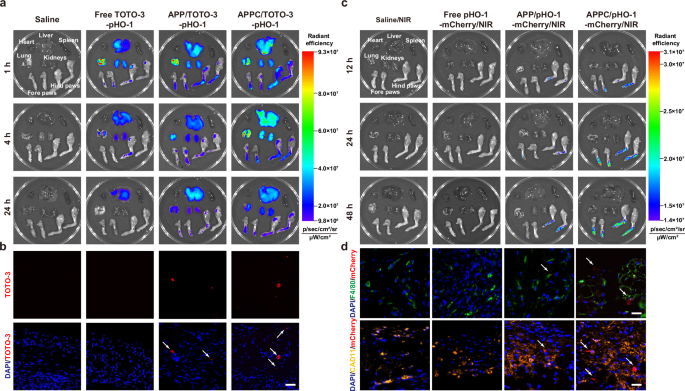
a Ex vivo biodistribution of free TOTO-3-labelled pHO-1, APP/TOTO-3-labelled pHO-1 and APPC/TOTO-3-labelled pHO-1 in CIA mice after the intravenous injection for 1, 4 and 24 h. b Representative images for the distribution of nanoparticles in the synovium of mice. Nuclei, blue (DAPI); TOTO-3, red. Scale bar: 50 μm. c Ex vivo expression of free pHO-1-mCherry, APP/pHO-1-mCherry and APPC/pHO-1-mCherry in CIA mice at 12, 24 and 48 h post-administration. d The mCherry expression in macrophages and FLSs in the synovium after NIR irradiation. Nuclei, blue (DAPI); F4/80, green; CAD11, yellow; mCherry, red. Scale bar: 25 μm. (a–d) Representative images of three biologically independent animals with similar results are shown.
To further validate the gene expression in specific tissues, mCherry fluorescence was analyzed in CIA mice following intravenous injection and subsequent NIR irradiation on the swollen joints. As depicted in Fig. 8c and Supplementary Fig. 49, no mCherry expression was observed in free pHO-1-mCherry group, which was attributed to the rapid clearance and degradation of free plasmid. In contrast, in APP/pHO-1 and APPC/pHO-1 groups, mCherry fluorescence was observed exclusively in the inflamed joints that received NIR irradiation, while no fluorescence was detected in other tissues. Although the nanoparticles demonstrated high accumulation in the liver and kidney, the mCherry was observed only in the swollen joint tissues, indicating that the NIR irradiation could specifically activate the gene expression in targeted tissues (Supplementary Fig. 50). In addition, the mCherry fluorescence gradually increased over time, which was possibly caused by the sustained promoter activation and progressive accumulation of the expressed protein. Moreover, immunofluorescence analysis was utilized to investigate the expression of mCherry in macrophages and fibroblasts of synovium, as characterized by marking F4/80 and cadherin-11 (CAD11) (Fig. 8d). Both APP/pHO-1-mCherry and APPC/pHO-1-mCherry nanoparticles showed fluorescence in macrophages and FLSs. This result indicated that the nanoparticles could be captured by these cells, and the gene expression was subsequently activated by NIR irradiation. Particularly, the APPC/pHO-1-mCherry nanoparticles exhibited stronger fluorescence in comparison to APP/pHO-1-mCherry, confirming that the APPC’s accumulation at inflammation sites via ELVIS and targeting properties. Moreover, targeted NIR irradiation ensured that the gene expression occurred primarily in the inflamed joint tissues, avoiding non-specific gene expression in unintended tissues.
Therapeutic effect of APPC/pHO-1 nanoparticles in CIA mice
To evaluate the therapeutic efficacy of HO-1 in the RA treatment, the nanoparticles harboring pHO-1 were intravenously administered to CIA mice (Fig. 9a). Arthritis severity was scored by paw swelling and clinical index (Fig. 9b and Supplementary Fig. 51). The mice treated with APPC, APP/pHO-1 (4:1) and APPC/pHO-1 (8:1) without NIR irradiation exhibited increasing paw thickness, indicatig that these treatments did not mitigate the RA progression (Supplementary Fig. 51a). However, both APP/pHO-1 (4:1) and APP/pHO-1 (8:1) under NIR irradiation reduced the swelling of hind paw, with no significant differences between these two dosages. Notably, APPC/pHO-1 (8:1) under NIR significantly inhibited the progression of RA, as evidenced by a reduction in paw swelling to the comparable level of healthy mice. The clinical index reflected similar trends, with the lowest values observed in APPC/pHO-1 group under NIR irradiation, demonstrating its superior therapeutic efficacy due to the enhanced accumulation of nanoparticles in inflamed tissues (Supplementary Fig. 51b). Macroscopic images of paws corroborated these findings, in which the APPC/pHO-1/NIR group showed the reduced swelling and redness of joint tisses (Fig. 9b). Further, the balance beam experiment was performed to assess the effect of different treatments on the behavioral ability of arthritic mice. As shown in Supplementary Fig. 52, the arthritic mice showed limited behavioral ability as evidenced by more time to pass the board, whereas the arthritic mice exhibited an improved locomotor ability after the treatment with APPC/pHO-1 nanoparticles under NIR irradiation. Micro-CT analysis further revealed the severe bone erosion in untreated mice, while APP/pHO-1 and APPC/pHO-1 groups under NIR irradiation could reduce the bone damage, ameliorate the abnormal ossifications and restore the bone intergrity, especially in APPC/pHO-1/NIR group (Fig. 9c). The improved bone parameters were also found in this group, including cortex bone mineral density (BMD), bone surface to bone volume ratio (BS/BV), trabecular thickness (Tb.Th) and trabecular spacing (Tb.Sp), indicating effective bone protection and restoration (Supplementary Fig. 53). Further, histological analysis showed substantial synovial infiltration, narrowed articular cavity and bone erosion in untreated mice, and the treatments of nanoparticles without NIR irradiation showed no therapeutic efficacy (Fig. 9d and Supplementary Fig. 54a). In contrast, the combination of APPC/pHO-1 and NIR significantly reduced the infiltration of inflammatory cells and minimized the pannus formation, leading to a notable reduction in bone erosion and cartilage degradation. Consequently, lower histological synovitis scores (HSS) were observed in this group, indicating a substantial remission in the inflammatory conditions of joints (Supplementary Fig. 54b). The cartilage preservation was assessed by Safranin O/Fast Green staining, in which the APPC/pHO-1/NIR group showed a thicker and more homogeneous cartilage layer compared to the untreated arthritic mice (Fig. 9e and Supplementary Fig. 55a). Accordingly, specific parameters including Mankin scores, proteoglycan (PG) scores, and bone erosion (BE) scores were significantly improved following the APPC/pHO-1/NIR treatment, indicating its favorable therapeutic efficacy in preserving the cartilage integrity of CIA mice (Supplementary Fig. 55b–d). The Toluidine blue staining further supported these findings (Fig. 9f). The nanoparticles containing pHO-1 exhibited the preserved cartilage structure after NIR irradiation, characterized by a larger blue-stained area of the joint. These results demonstrated that HO-1 significantly inhibited cartilage damage and mitigated disease progression. Collectively, APPC/pHO-1 nanoparticles under NIR irradiation effectively reduced the synovial hyperplasia and prevented the destruction of bone and cartilage, thereby achieving therapeutic efficacy in CIA mice.
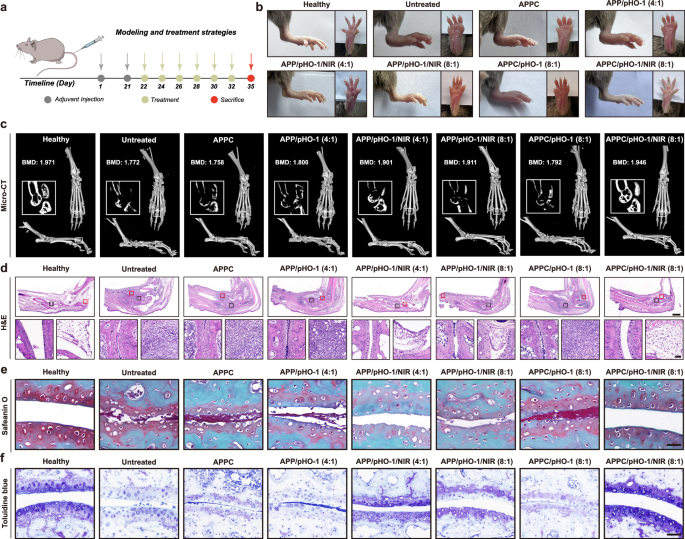
a The therapeutic strategy in CIA mice. b The macroscopic observation to assess the swelling severity of soft tissue at Day 35 post-adjuvant induction. c The representative micro-CT images of arthritis mice after different treatments at Day 35 post-adjuvant induction. d H&E staining of the arthritis ankles of CIA mice. Scale bar: 100 μm. The red region represented the bone erosion (bottom left) and infiltration of synovial tissues (bottom right). Scale bar: 50 μm. e, f Articular cartilages of ankle joints were identified by Safranin O/Fast Green staining and Toluidine blue, respectively. Scale bar: 50 μm. b–f Representative images of five biologically independent animals with similar results are shown.
Further, immunohistochemistry (IHC) was conducted to verify whether the therapeutic effects were attributed to the HO-1’s impact on cellular metabolism. As shown in Fig. 10a and Supplementary Fig. 56a, low HO-1 levels were observed in the ankle joints of healthy and arthritic mice, and the nanoparticles containing pHO-1 did not elevate the HO-1 expression in the absence of NIR irradiation. When NIR irradiation was used, these nanoparticles significantly increased the HO-1 expression, and the arthritic mice in the APPC/pHO-1 (8:1) group showed the highest elevation of HO-1. This phenomenon was attributed to APPC’s superior targeting ability and NIR-induced gene expression, leading to the improved treatment in RA. Meanwhile, the Hmxo1 mRNA levels could be found to be elevated in arthritic joints after the pHO-1 delivery under NIR irradiation, which were consistent with IHC results (Supplementary Fig. 57a). In addition, the arthritic mice exhibited elevated glycolysis in inflamed joints, as evidenced by a significant increase in Glut1, Hk2 and Ldha expression (Fig. 10b, c, Supplementary Fig. 56b and c, and Supplementary 57b–d). Clearly, APP/pHO-1/NIR slightly decreased the expresssion of these genes, and APPC/pHO-1/NIR (8:1) inhibited the glycolytic process in the inflamed joints more effectively.
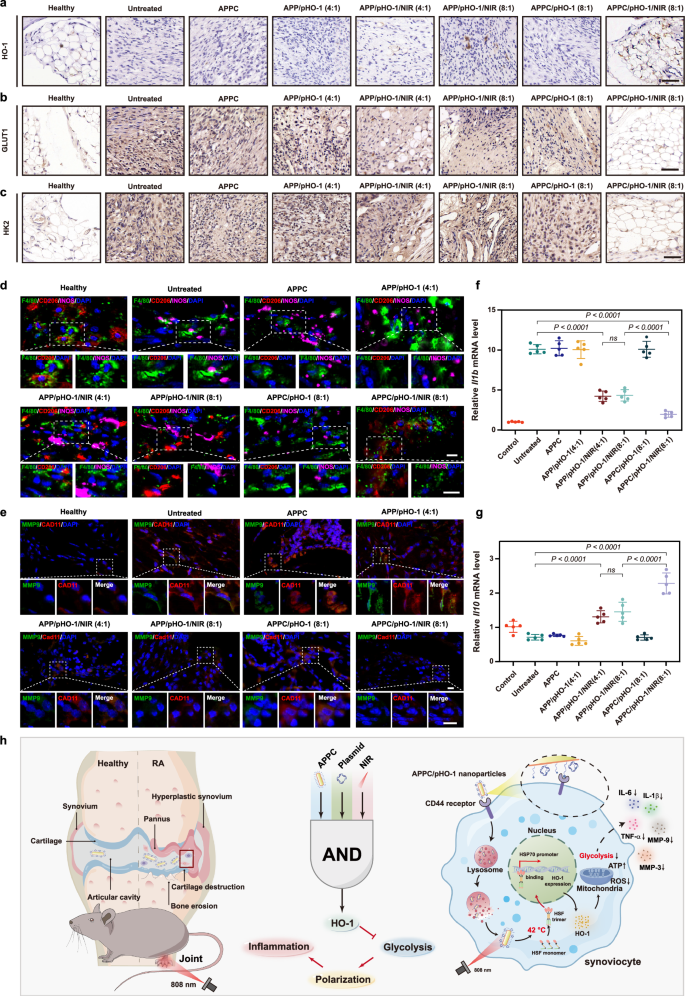
a–c Levels of HO-1, GLUT1, and HK2 in the arthritic joints of CIA mice detected by IHC. Scale bar: 50 μm. d Effect of APPC/pHO-1 on the phenotype of macrophages in the synovial tissues of CIA mice, assessed by the immunofluorescence staining of CD206 and INOS. Nuclei, blue (DAPI); F4/80, green; CD206, red; INOS, violet. Scale bar: 10 μm. e Effect of APPC/pHO-1 on the phenotype of FLSs in the synovial tissues of CIA mice, assessed by the immunofluorescence staining of CAD11 and MMP9. Nuclei, blue (DAPI); MMP9, green; CAD11, red. Scale bar: 20 μm. f, g The mRNA level of Il1b and Il10 in the arthritic joints of CIA mice. Data are presented as mean value ± SD (n = 5 independent animals), and one-way ANOVA with LSD test is selected for statistical analysis. h The schematic presentation of APPC/pHO-1 intravenously injected into CIA mice. Following the injection, the nanoparticles could be accumulated in inflamed joints via ELVIS effect and further captured by the synoviocytes via CD44 receptor. Under NIR irradiation, HSF monomers in synoviocytes aggregated into trimers, which translocated to the nucleus to bind to the HSP70 promoter and subsequently triggered the HO-1 expression, leading to the suppression of inflammation by inhibiting glycolysis to ultimately attenuate the symptoms of RA. a–e Representative images of five biologically independent animals with similar results are shown. Source data are provided as Source Data files.
Metabolic changes in inflamed tissues were further assessed by the phenotype of macrophages, focusing on the expression of INOS (M1) and CD206 (M2). As depicted in Fig. 10d, arthritic mice displayed increased INOS and decreased CD206 expression, indicating a predominance of pro-inflammatory M1 macrophages. In APPC/pHO-1/NIR group, the macrophage polarization shifted towards the anti-inflammatory M2 phenotype to effectively disrupt the inflammatory environment, as evidenced by the increased CD206 expression. Similarly, the biomarkers CAD11 and MMP9 of FLSs were analyzed (Fig. 10e). Low levels of CAD11 and MMP9 in healthy mice confirmed the absence of invasive phenotype FLSs, whereas the arthritic mice showed elevated levels of these biomarkers, indicating a shift to an invasive phenotype in RA. The administration of APPC/pHO-1 under NIR irradiation significantly reduced the levels of these factors, thereby suppressing the invasive phenotype of FLSs in RA. These findings demonstrated that the activation of Hmxo1 gene by NIR suppressed both inflammatory phenotypes of macrophages and FLSs at arthritic joints by inhibiting glycolysis to facilitate the relief of RA symptoms. In addition, the APPC/pHO-1/NIR treatment reduced the secretion of pro-inflammatory cytokines in the synovium and serum of CIA mice, demonstrating the effective control of inflammation (Fig. 10f and Supplementary Fig. 58). The mRNA analysis also elucidated that the APPC/pHO-1/NIR treatment significantly increased the expression of anti-inflammatory cytokines including Il4, Il10 and Arg1, confirming the HO-1’s role in promoting anti-inflammatory response (Fig. 10g and Supplementary Fig. 59). Inflammatory factors and chemokines secreted by inflammatory macrophages and invasive synoviocytes form a concentration gradient, which in turn induces the infiltration of T lymphocytes into inflamed joints. As shown in Supplementary Fig. 60, CD4+ and CD8+ T cells appeared the infiltration in the joints of CIA mice, which was significantly reversed by APPC/pHO-1 nanoparticles under NIR irradiation. This phenomenon was attributed to the metabolic reprogramming properties of nanoparticles, which inhibited the key enzymes of glycolysis (HK2, LDHA) and glucose uptake to decrease the energy metabolism of T cells. Concurrently, the secondary activation of T cells was blocked by the microenvironmental modulation to reduce the production and accumulation of lactate. These results confirmed the inhibitory effect of APPC/pHO-1 nanoparticles on the T lymphocyte infiltration in the joints of CIA mice. Finally, the biocompatibility of APPC/pHO-1 nanoparticles was evaluated. As shown in Supplementary Fig. 61, the mice receiving APP/pHO-1 and APPC/pHO-1 nanoparticles showed comparable serum biochemical parameters to the healthy mice, indicating no hepatic or renal damage. The H&E staining of main organs (heart, liver, spleen, lung and kidney) revealed no lesions in the mice after the administration of these nanoparticles, meaning their favorable biocompatibility (Supplementary Fig. 62). Additionally, NIR irradiation in inflamed joints did not induce systemic toxicity, further indicating the safety of this treatment.
Immunogenicity is one of the limiting factors for nanoparticles to execute the in vivo function. To evaluate the immunogenicity of APPC/pHO-1 nanoparticles, the change in serum inflammatory factors was measured. The results showed that the levels of inflammatory factors, including IL1B, IL6, and TNF, were not significantly affected after the injection of APPC/pHO-1 nanoparticles (Supplementary Fig. 63a). Then the serum levels of IgM and IgG antibodies were detected to analyze the initial and long-term immune activation by APPC/pHO-1 nanoparticles, respectively. As shown in Supplementary Fig. 63b, there were almost no changes in the antibody levels after the multiple injections of APPC/pHO-1 nanoparticles. Finally, the spleens were collected to prepare the cell suspension for the flow cytometic analysis to reflect the variation of major immune cells (Supplementary Fig. 63c–h), the percentages of CD3+CD4+ T cells, CD3+CD8+ T cells, DC cells (CD11c+CD80+CD86+), and M1 (CD11b+F4/80+CD86+) and M2 (CD11b+F4/80+CD206+) macrophages remained almost unchanged after the administration of APPC/pHO-1 nanoparticles. These results confirmed that the APPC/pHO-1 nanoparticles were of no immunogenicity, further paving the way for their applications in RA treatment.

