

Intersecting targets of GE and RA
Based on draft guidelines for evaluating network pharmacology methods, using the 2D structural formula of GE as illustrated in Fig. 2A, a network pharmacology prediction of GE was conducted. Potential targets for the effects of GE were gathered from the databases such as TCMSP (8 targets), SwissTargetPrediction (41 targets), Pharmmapper (296 targets), and Batman (1 target). After culling duplicate targets, we obtained 330 potential targets for drug action. Detailed target information is provided in Supplement Table 1. The differentially expressed genes (DEGs) in RA were filtered from the GSE55235 dataset using the’limma’package. A total of 1324 genes were screened under the conditions of |log (FC)|≥ 1 and p value < 0.05, including 740 up-regulated and 584 downregulated genes. The volcano plot visualization of differential genes in the GSE55235 dataset is shown in Fig. 2B. The Venn diagram revealed 53 common targets shared between GE drug targets and RA DEGs (Fig. 2C), and a heat map showing the differential expression of which is presented in Fig. 2D.
Intersecting targets of GE and RA.. (A) 2D structure of drug GE. (B) Volcano plot representing differentially expressed genes in the datasets GSE55235: grey indicates genes with no difference, red represents upregulated genes, and blue denotes downregulated genes. (C) Intersection targets of disease and drug. (D) Heatmap showcasing of differentially expressed genes. The x-axis represents samples from the two datasets, while the y-axis displays the differentially expressed genes. Red indicates high expression and blue signifies low expression.
Screening of key targets of GE against RA
Next, 53 potential anti-RA targets were analyzed by using the STRING database to create a PPI network (Supplement Figure 1). The reason why we consider the threshold value of 0.4 in PPI as the limiting value is mainly because when we adjust the threshold value to 0.7, we find that there are four scattered sub-networks after processing in string database, and eight genes in one sub-network are interconnected, which will affect the final screening result if we directly abandon it. Moreover, when we adjust the threshold value to 0.9, many sub-networks appear, and each sub-network has fewer genes. The PPI network map was imported into Cytoscape 3.9.0 for visualization (Figure 3A). Figure 3 shows the identified subnetwork with 12 key targets: EGFR, MMP-9, CCL5, PPARG, STAT1, HCK, SYK, MAPK8, CTSB, RAC2, JAK2, and TYMS. These targets are considered to play significant roles in the action of GE against RA, and further details about the 12 key targets are available in Supplement Table 2.

Screening key targets of GE against RA. (A) The PPI network of 53 common targets is drawn by cytoscape. The darker the color and the larger the shape, the higher the Degree value. (B) Hub genes were screened from the PPI network using the Betweenness (BC), Closeness (CC), Degree (DC), and Network (NC) methods. (C) Subnetwork of the PPI network of 12 hub targets.
GO and KEGG enrichment analysis
The GO analysis identified 769 significantly enriched GO terms (p < 0.01 with Benjamini-Hochberg correction), comprising 650 biological processes, 40 cell components, and 79 molecular functions. The top 20 GO entries were further screened, as shown in Figure 4A-C. In the biological process (GO: BP) category, the top-ranked terms include leukocyte migration, leukocyte cell-cell adhesion, and response to peptides. In the cell component (GO: CC) category, the top-ranked terms include the extracellular matrix containing collagen, membrane microdomains, and the vesicle lumen. In the molecular function (GO: MF) category, the top-ranked terms include peptidase activity, serine hydrolase activity, and protein kinase activity for serine, threonine, and tyrosine. To identify potential signaling pathways, an analysis of the KEGG pathways were conducted. Figure 4D shows the top 20 significantly enriched pathways (p value < 0.01). A list of genes involved with the 20 selected pathways is provided in Supplement Table 3. Several targets have been found to be associated with signaling pathways related to the pathogenesis and prognosis of RA, including IL-17, JAK-STAT, and TNF signalin pathways..

Functional analysis of differentially expressed genes. (A-C) The GO enrichment analysis results showed that leukocyte migration, leukocyte cell–cell adhesion was significantly enriched in RA. (D) KEGG results showed that IL-17 and JAK-STAT signaling pathways were significantly enriched in RA.
The ROC diagnostic curve analysis of the key targets
The ROC curve (Figure 5) was generated to further assess the diagnostic potential of the 12 key genes. The results demonstrated that the AUC values were as follows: CCL5 and SYK had values of 1.0, PPARG, STAT1, and TYMS had values of 0.99, HCK had 0.98, CTSB had 0.97, EGFR, MMP-9, and MAPK8 had 0.96, RAC2 had 0.95, and JAK2 had 0.93. This finding suggests that the key genes possess high accuracy and specificity in distinguishing RA samples from those of normal controls.

ROC curves of the 12 key genes in the datasets GSE55235 for RA diagnosis.
Molecular docking
Molecular docking analysis was conducted to evaluate the interactions between the drug and its target, to predict their binding affinity, and to validate the network analysis results. In this analysis, GE acted as a ligand, while 12 key genes served as receptors: EGFR (PDB: 2RGP), MMP-9 (PDB: 5TH6), CCL5 (PDB: 6AEZ), PPARG (PDB: 2ZVT), STAT1 (PDB: 3WWT), HCK (PDB: 2HK5), SYK (PDB: 3SRV), MAPK8 (PDB: 3ELJ), CTSB (PDB: 1GMY), RAC2 (PDB: 2W2T), JAK2 (PDB: 5L3A), and TYMS (PDB: 1YPV). The molecular docking and binding energy results for GE and the 12 key target proteins were as follows: GE-EGFR (−8.06 kcal/mol), GE-MMP-9 (−9.24 kcal/mol), GE-CCL5 (−8.97 kcal/mol), GE-PPARG (−9.24 kcal/mol), GE-STAT1 (−7.51 kcal/mol), GE-HCK (−9.73 kcal/mol), GE-SYK (−9.22 kcal/mol), GE-MAPK8 (−11.6 kcal/mol), GE-CTSB (−9.12 kcal/mol), GE-RAC2 (−8.34 kcal/mol), GE-JAK2 (−9.41 kcal/mol), and GE-TYMS (−8.47 kcal/mol), all less than −5 kcal/mol, demonstrating good binding activity. PyMOL was utilized to create 3D binding pattern maps, as shown in Figure 6, to show the potential interaction between GE and the 12 targets.

3D mode diagram of molecular docking. (A) EGFR and GE. (B) MMP-9 and GE. (C) CCL5 and GE. (D) PPARG and GE. (E) STAT1 and GE. (F) HCK and GE. (G) SYK and GE. (H) MAPK8 and GE. (I) CTSB and GE. (J) RAC2 and GE. (K) JAK2 and GE. (L) TYMS and GE.
Cell proliferation and toxic effects of GE on RA-FLS
FLS play a crucial role in the pathogenesis of RA. The Healthy FLS (HFLS) and RA-FLS cells needed for the experiment were cultured in a 37 ℃ incubator with 5% CO2. The effect of GE on RA-FLS cell proliferation was assessed by using the MTT assay. Additionally, the toxic effects of various concentrations of GE on HFLS were tested. After the MTT reagent reacted with the cells, the optical density (OD) value, measured at 490 nm using a microplate reader, was proportional to the number of cells. The MTT experiment results demonstrated a dose-dependent of RA-FLS response to different concentrations of GE (Figure 7B). Notably, a concentration of 200 μM was cytotoxic to HFLS after 48 hours (Figure 7A). The results of IC50 assay showed that the 50% inhibitory rate of the drug was 67.47 μM at 24 h and 31.76 μM at 48 h (Supplement Figure 2). Based on the MTT experiment results, we selected cells treated with GE at doses of 0, 25, 50, and 100 μM for subsequent experiments.
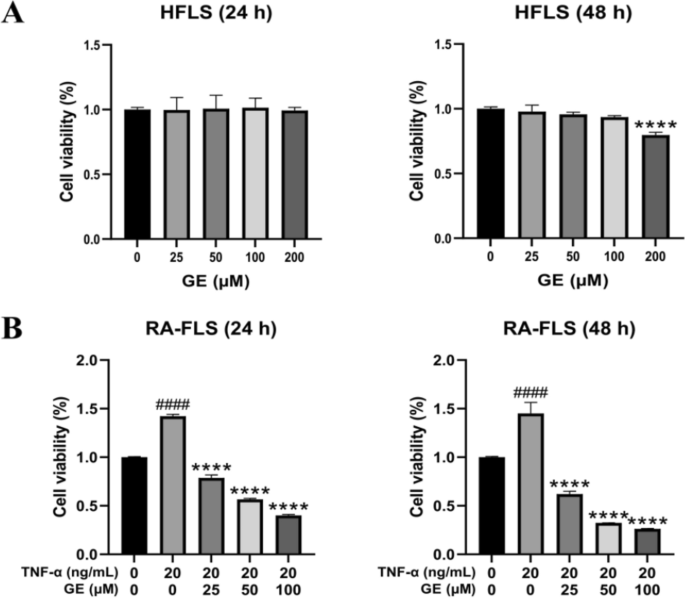
Effect of different concentrations of GE on cell viability in RA-FLS and HFLS cells for 24 h and 48 h. (A) GE added HFLS produced cytotoxicity at 200 μM for 24 h and 48 h. (B) GE inhibited the proliferation of RA-FLS cells in a dose-dependent manner. Compared with the blank control group, ####P < 0.0001. Compared with the TNF-α stimulus group, ****P < 0.0001.
Effect of GE on the levels of inflammatory factors in RA-FLS
The inflammatory response is a key pathological process in the development of RA, and measuring inflammatory factors can help determine the severity of the disease and also reflect the cell response to drugs. As shown in Figure 8, the ELISA results indicate that after TNF-α stimulation, the levels of IL-17, IL-8, TNF-α, MMP-3, and MMP-9 in RA-FLS significantly increased, as shown in classical inflammatory responses. Following the addition of varying concentrations of GE, their levels exhibited a concentration-dependent decrease. These results indicated that GE can inhibit the production of inflammatory factors in RA-FLS cells, which supports its potential application in the treatment of RA.
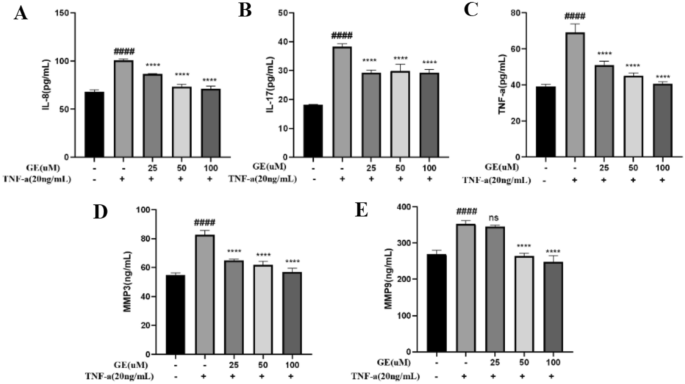
Effect of different concentrations of GE on inflammatory cytokine release in RA-FLS cells. After 24 h of GE treatment, the expression level of inflammatory factors in the supernatant of RA-FLS cells was determined by ELISA assay. (A) IL-8. (B) IL-17. (C) TNF-α. (D) MMP-3. (E) MMP-9. Compared with the blank control group, ###P < 0.001. Compared with the TNF-α stimulus group, **P < 0.01, ****P < 0.0001.
Effects of GE on mRNA expression of key targes identified by network pharmacology in RA-FLSs
Network pharmacology was used to screen and identified 12 key targets relating with both RA and GE, including EGFR, MMP-9, CCL5, PPARG, STAT1, HCK, SYK, MAPK8, CTSB, RAC2, JAK2, and TYMS. RT-qPCR was used to detect changes in mRNA expression to assess whether GE influenced the expression of these key targets and could potentially exert anti-RA effects (The primer sequences for 12 key targets are listed in Supplement Table 4). RT-qPCR results indicated that after co-incubation of RA-FLS with TNF-α for 24 hours, EGFR, MMP9, CCL5, STAT1, SYK, MAPK8, and JAK2 were significantly up-regulated, while PPARG was significantly downregulated,the other four targets showing no statistically significant change (Figure 9). However, the addition of the drug GE along with TNF-α stimuli reversed the mRNA expression effects of TNF-α on these 8 out of 12 key targets. This validates the results of network pharmacology, suggesting that GE affects the mRNA expression of the eight key targets in RA-FLS.
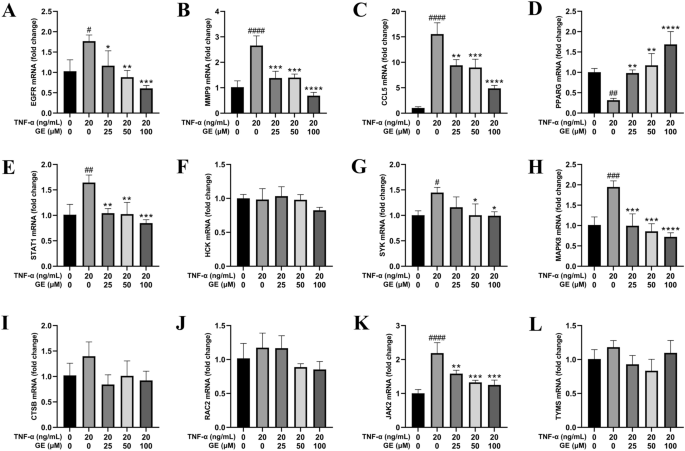
GE inhibits the mRNA expression of key targets in TNF-α-induced RA-FLS. (A-L) The effect of GE on the mRNA levels of core genes in RA-FLS stimulated by TNF-α. Compared with the blank control group, #P < 0.05, ##P < 0.01, ###P < 0.001, ####P < 0.0001. Compared with the TNF-α stimulus group, *P < 0.05, **P < 0.01, ***P < 0.001, ****P < 0.0001.
Effects of GE on JAK-STAT signaling pathways in RA-FLSs
The KEGG pathway is enriched in IL-17 and JAK-STAT signaling pathways. The JAK-STAT signaling pathway is an important cytokine transduction pathway. By inducing the production of specific cytokines, such as IL-17, the JAK-STAT signaling pathway enhances the autoimmune response and leads to joint inflammation. Activation of this signaling pathway can promote the proliferation of synovial fibroblasts and other immune cells, resulting in exacerbated pathological changes. The JAK-STAT pathway also influences the differentiation of T cell subsets, particularly in regulating the generation of Th17 cells, which are believed to play a critical role in the pathogenesis of RA. Therefore, we examined the effect of GE on the JAK-STAT signaling pathway using a western blot assay (The raw data with three repetitions is shown in Supplement Figure 3). Figure 10 shows that GE could significantly inhibit P-JAK1 and P-STAT1 protein expression in RA-FLS cells and reduce the levels of inflammatory factors, thus diminishing the inflammatory response in RA. The above results suggest that GE may exert its anti-RA effects by inhibiting the phosphorylation of the JAK-STAT signaling pathway proteins.
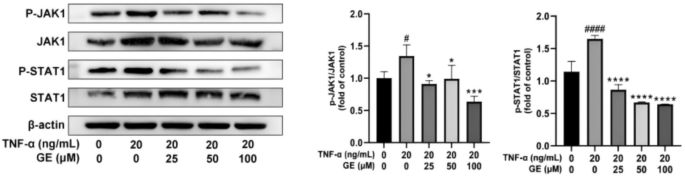
GE inhibits the activation of JAK/STAT pathway in TNF-α-induced RA-FLS. FLS for p-JAK1 and p-STAT1 were starved in 10% FBS medium, pretreated with GE and 20 ng/ml TNF-α for 48 h before collection. The phosphorylation of JAK1 and STAT1 in FLS were measured by western blot. Compared with the blank control group, #P < 0.05, ##P < 0.01, ###P < 0.001, ####P < 0.0001. Compared with the TNF-α stimulus group, *P < 0.05, **P < 0.01, ***P < 0.001, ****P < 0.0001.
GE alleviated inflammation in CIA mice
In order to explore the relieving effect of GE on inflammatory symptoms of CIA mice, we established CIA model and injected GE intraperitoneally for 14 days (The specific modeling process is shown in Figure 11A). We observed the state, weight and degree of joint swelling of mice. After the model was established, the activity of mice decreased and the coat became dark. Compared with the model group, the low-dose (GE-L) and high-dose GE (GE-H) groups could delay the weight loss of CIA mice and reduce the swelling of their hind paws (Figure 11B-C). The results of ELISA serum test (Figure 11D) showed that, compared with the model group, the low-dose and high-dose GE group could reduce the content levels of pro-inflammatory factors IL-17, TNF-α, IL-8, MMP-3 and MMP-9, and increase the content level of anti-inflammatory factor IL-10. The therapeutic effect of high concentration drug group is close to that of positive drug MTX group. HE staining results suggested that GE could significantly alleviate the symptoms of cartilage destruction and inflammatory cell immune infiltration in CIA mice (Figure 11E). These data show that GE plays a significant role in alleviating the inflammatory symptoms of CIA mice.

GE attenuated the severity of arthritis in CIA mice. (A) In vivo experiment flow chart. (B) Observation of foot paw swelling in CIA model mice induced by GE. (C) Effects of GE on body weight and hind paw swelling of CIA model mice. (D) ELISA was used to detect the effect of GE on the inflammation of CIA model mice. (E) HE staining results of CIA mice joints after GE treatment. Black arrows indicate cartilage destruction, and asterisks indicate inflammatory cell infiltration. Compared with Control group, ####P < 0.0001. Compared with CIA group, *P < 0.05, **P < 0.01, ***P < 0.001, ****P < 0.0001.