Proteomic characterization in at-risk, ACPA-positive and ACPA-negative RA individuals
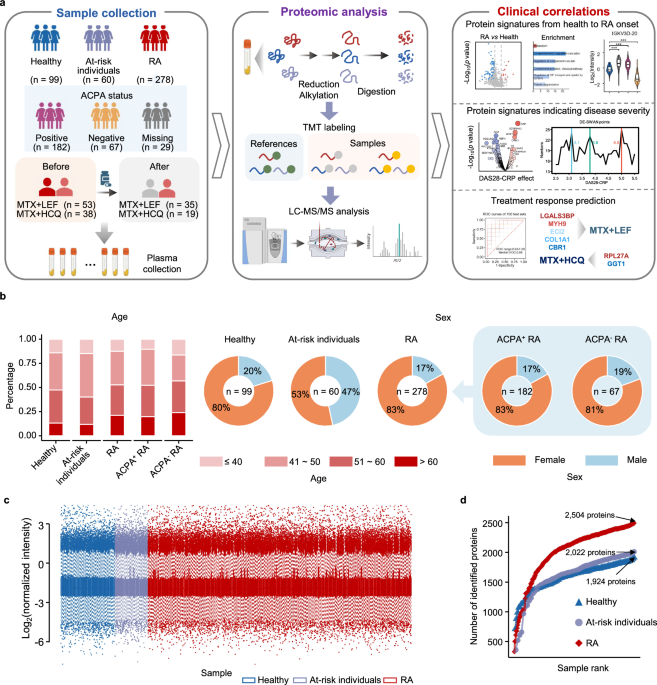
We recruited 278 RA patients from the western region of China; among them, 231 were females (83%) (Fig. 1a, b and Supplementary Data 1). The average age of RA patients was 51 years, ranging from 16 to 77 years. The disease activity score in 28 joints with C-reactive protein (DAS28-CRP) varied from 1.24 to 8.39, with an average value of 3.53. The ACPA-negative individuals were slightly older, with an average age of 52 (vs 51 for ACPA-positive RA patients) and lower DAS28-CRP scores of 3.07 (vs 3.71 for ACPA-positive RA patients) (Supplementary Table 1). Patients included in the study had not received csDMARDs treatment for at least 6 months prior to the collection of plasma samples. Among the 206 RA patients with follow-up data, 140 had one follow-up sample at 3–6 months, and 59 had two follow-up samples at 6–9 months after receiving MTX monotherapy or csDMARDs combination treatments. In addition, we recruited 60 at-risk individuals, 38 of whom were followed up for 5–7 years, and 99 healthy controls for comparative analysis. The average age of healthy controls was 51 years, with a range of 38–76 years (79 females and 20 males). The average age of 60 at-risk individuals was 48 years (32 females and 28 males), ranging from 29 to 74 years (Supplementary Table 1).
a Schematic design of the study (created with BioRender.com. Sun, R. (2025) https://BioRender.com/6iee3nb). b Bar plot (left) and pie charts (right) depicting the age and sex group distribution across different clinical subgroups. c Distribution of log2-transformed protein (n = 996) intensities normalized to those of common reference samples. Box plots showing the median (center line), the 25th and 75th percentiles (bounds of box), and the minimum and maximum values (whiskers). d Cumulative number of identified proteins for healthy controls (blue, n = 99), at-risk individuals (violet, n = 60), and RA patients (red, n = 278). ACPA+ indicates ACPA-positive, and ACPA− indicates ACPA-negative. Source data are provided as a Source Data file.
Next, we performed tandem mass tag (TMT)-based proteomics analysis of these plasma samples (Fig. 1a and Supplementary Data 2). Correlation analysis of quality control samples (Supplementary Fig. 1a), common reference samples (Supplementary Fig. 1b), and replicate samples revealed the high quality of our mass spectrometry (MS) data (Supplementary Fig. 1c). The observed stability in the distribution of normalized protein abundance also indicated minimal batch effects (Fig. 1c). A total of 2504, 2022, and 1924 proteins were identified from RA, at-risk individuals and healthy individuals, respectively (Fig. 1d). Proteins quantified in more than 50% of the samples in each group of individuals, totaling 996 plasma proteins, were used for the subsequent data analysis.
Plasma proteome fluctuations from health to RA onset
We initially performed hierarchical clustering on plasma proteome data from 182 ACPA-positive RA, 67 ACPA-negative RA, 60 at-risk individuals, and 99 healthy controls (Fig. 2a), revealing clear distinctions between these groups (Fig. 2b). Comparative analyses identified a number of differentially expressed proteins (DEPs) and pathways between ACPA-positive RA patients, ACPA-positive RA patients, at-risk individuals and healthy controls (two-sided Student’s t test, p < 0.05) (Fig. 2c and Supplementary Fig. 1d,e). Then, we combined proteins that differed between healthy and other groups and performed pathway enrichment analysis (Fig. 2c). This analysis revealed the upregulation of proteins associated with neutrophil degranulation, cellular stress responses, and cross-presentation of soluble exogenous antigens in both ACPA-positive RA patients and at-risk individuals21,22,23. However, ACPA-positive RA patients presented more intense immune and acute-phase responses (Fig. 2c). In contrast, the downregulated proteins were primarily involved in metabolic dysregulation, redox processes such as hydrogen peroxide catabolism, and protein processing, suggesting increased endoplasmic reticulum stress24,25,26. Notably, proteins specifically elevated in at-risk individuals were linked to RNA metabolism, which is recognized for its connection to inflammation27. Additionally, we observed the upregulation of ROBO receptor signaling, which inhibits osteogenic differentiation, and axon guidance pathways, both of which are known to be upregulated in RA28,29 (Fig. 2c).
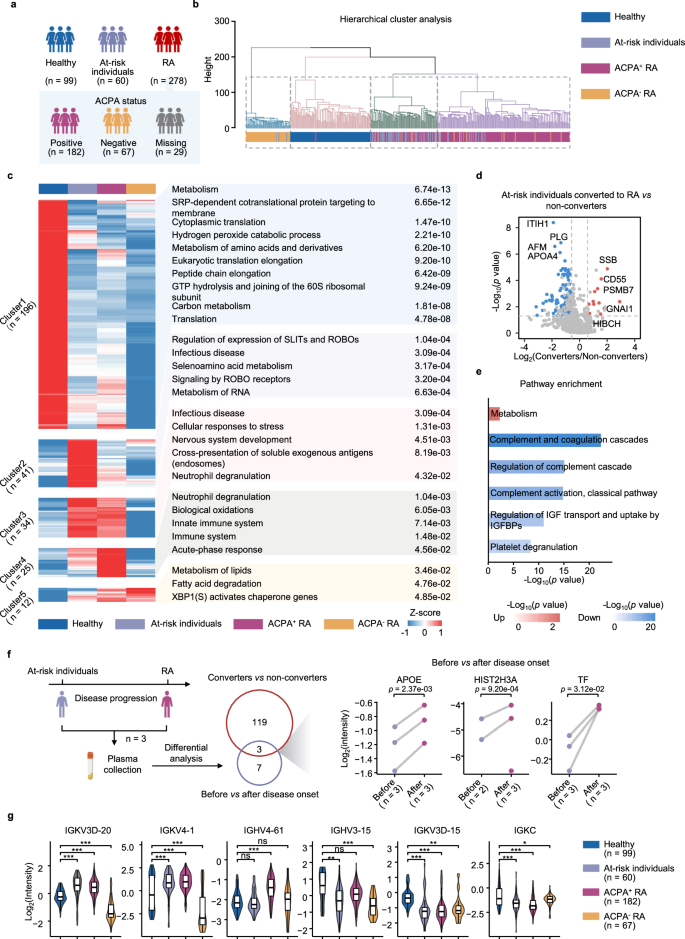
a Number of individuals in different clinical subgroups. b Dendrogram illustrating hierarchical clustering of proteomic data across samples. c Heatmap displaying unsupervised k-means clustering of proteins across healthy individuals, at-risk individuals, ACPA-positive RA patients and ACPA-negative RA patients (two-sided Student’s t test, p < 0.05 and 1.5-fold change). The top enriched pathways for each cluster are shown (two-sided Fisher’s exact test, p < 0.05). d Volcano plot of differentially expressed proteins (DEPs) between at-risk individuals who converted to RAs (converters) and non-converters (two-sided Student’s t test, p < 0.05 and 1.5-fold change). The red and blue dots represent upregulated and downregulated proteins, respectively. e Bar plot displaying the top enriched pathways of DEPs between converters and non-converters (two-sided Fisher’s exact test). f Schematic (left) of proteomic analysis design for samples collected from three at-risk individuals before and after RA onset (created with BioRender.com. Sun, R. (2025) https://BioRender.com/6iee3nb). Venn diagram (middle) showing overlapped DEPs in two comparisons: red circle includes DEPs between converter and non-converter; blue circle includes DEPs before and after RA onset in three converters. Scatter plot (right) displaying the intensity of the overlapped DEPs before and after RA onset (two-sided Student’s t test). g Violin plot displaying the intensity of antibody segments across four clinical groups (two-sided Student’s t test). Box plots inside showing the median (center line), the 25th and 75th percentiles (bounds of box), and the minimum and maximum values (whiskers). ACPA+ indicates ACPA-positive, and ACPA– indicates ACPA-negative. Significance is indicated as follows: *p < 0.05, **p < 0.01 and ***p < 0.001, ns means p ≥ 0.05. Source data are provided as a Source Data file.
The differences in proteome profiles between ACPA-positive and ACPA-negative RA patients remain poorly understood, despite variations in clinical characteristics, disease progression, and treatment response. We observed a stronger inflammatory response in ACPA-positive RA patients, which remained significant even after adjusting for the DAS28-CRP between the two subsets. These findings suggest that increased inflammation is an intrinsic effect of the ACPA-positive phenotype, independent of disease activity (Supplementary Fig. 1f).
Autoimmune disorders may share common pathogenic mechanisms. Therefore, we studied whether the top enriched proteins in RA patients also showed abnormal expression in patients with other autoimmune diseases, including primary Sjögren’s syndrome, systemic sclerosis, idiopathic inflammatory myopathy, and systemic lupus erythematosus, compared with healthy controls. The results confirmed the RA specificity of these DEPs, as most did not significantly differ between the patients with other autoimmune diseases and healthy controls (Supplementary Fig. 1g).
Age and sex can significantly impact proteome analysis30. However, we did not observe significant age differences between healthy controls, at-risk individuals, and RA patients (Supplementary Fig. 1h). Consequently, we analyzed proteomic differences stratified by sex (Supplementary Fig. 1d, e). Compared with those in the other groups, most DEPs in the ACPA-positive RA group were consistent regardless of sex, showing a common trend of increased neutrophil degranulation, complement cascade regulation, and acute-phase response. Compared with RA patients, at-risk individuals presented higher levels of ROBO receptor signaling and RNA metabolism, with RNA metabolism being more elevated in males. In contrast, axon guidance was more pronounced in male RA patients, indicating increased bone remodeling pressure31. ACPA-negative RA patients exhibited a distinct increase in lipid metabolism, with elevated fatty acid β-oxidation specifically in males (Supplementary Fig. 1e).
The preclinical phase of RA is a crucial period for identifying pathogenic mechanisms and potential prevention targets. We followed up 38 at-risk individuals, of whom 8 developed RA (converters). These converters exhibited significantly lower complement component levels, suggesting depletion due to immune complex formation during the transition to RA32. Additionally, metabolism-related proteins such as PSMB7 were upregulated, indicating immunoproteasome activation33 (Fig. 2d, e). For 3 of these converters, we collected plasma samples to compare proteomic differences before and after disease onset (Fig. 2f). Commonly identified proteins between converters and non-converters, as well as before and after RA onset, included APOE, HIST2H3A, and TF. These findings highlight the roles of lipid metabolism dysregulation, neutrophil extracellular trap formation, and iron homeostasis in RA development34,35,36.
IgG has dual roles in the pathogenesis of RA37,38. We identified specific IgG segments with varying levels in the disease groups compared with those in the healthy controls. Specifically, IGKV3D-20, IGKV4-1, and IGHV4-61 increased in ACPA-positive RA or at-risk individuals, whereas IGHV3-15, IGKV3D-15, and IGKC decreased. Additionally, all the differential IgG segments were the lowest in ACPA-negative RA patients (Fig. 2g).
Identification of proteins associated with disease activity
Next, we investigated the proteins associated with disease activity. We observed significant sex differences in the DAS28-CRP scores among ACPA-positive RA patients, with higher disease activity in males than in females. In contrast, ACPA-negative RA did not show such sex-related differences (Fig. 3a, b). Owing to disease activity increasing with age, specifically in ACPA-positive females (Fig. 3c, d and Supplementary Fig. 2a), differentially expressed sliding window analysis (DE-SWAN) was conducted exclusively on female ACPA-positive RA patients. This analysis revealed a rapid decrease in the number of age-associated proteins after the age of 45 in females (Fig. 3e). In our study, this age categorization further revealed disparities in DAS28-CRP, where females younger than 45 years presented reduced disease activity relative to their counterparts older than 45 years (Fig. 3f). In terms of clinical indicators, both the tender joint count (TJC) and CRP level exhibited similar trends, with both increasing in females over 45 years of age (Fig. 3f).
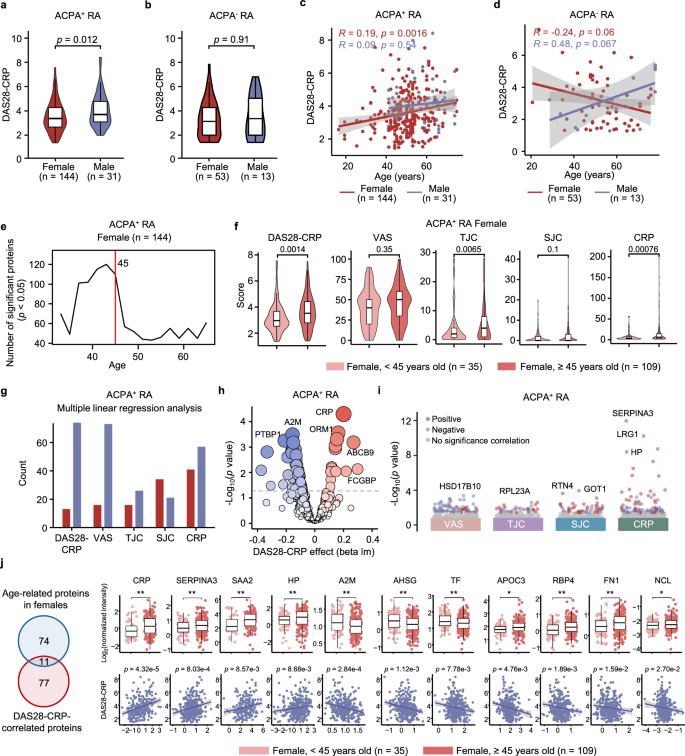
Violin chart of the DAS28-CRP scores grouped by sex in ACPA-positive (a) or ACPA-negative (b) RA patients (two-sided Student’s t test). Scatter plot with fitted regression lines illustrating Spearman’s correlation (two-sided p value) between age and DAS28-CRP grouped by sex in ACPA-positive (c) or ACPA-negative RA (d). Gray band represents 95% confidence interval estimated using standard error of the mean (SEM). e DE-SWAN analysis of proteins across age in ACPA-positive females, with a peak at age 45 indicated by the red line. f Violin plot illustrating age-specific differences in DAS28-CRP and 4 clinical indicators (VAS, SJC, TJC and CRP) in ACPA-positive females aged above and below 45 years (two-sided Student’s t test). g–i Multiple linear regression analysis (adjusted for age and sex, two-sided p value < 0.05) between DAS28-CRP indicators and proteins in ACPA-positive RA patients (n = 175). Bar plot showing the number of proteins significantly correlated with DAS28-CRP indicators (g), bubble plot displaying the regression analysis between proteins and DAS28-CRP (h), and dot plot visualizing the regression analysis between proteins and VAS, TJC, SJC and CRP (i). j Venn diagram showing the overlap of proteins that exhibit significant changes between ACPA-positive females below and above 45 years or are significantly correlated with DAS28-CRP (left). Boxplots (right upper) displaying the normalized intensity of overlapped proteins across ACPA-positive females below and above 45 years (two-sided Student’s t test). Scatter plots (right below) showing regression analysis between proteins and DAS28-CRP (adjusted for age and sex, two-sided p value). Gray band represents 95% confidence interval estimated using SEM. ACPA+ indicates ACPA-positive, and ACPA− indicates ACPA-negative. Significance is indicated as follows: *p < 0.05 and **p < 0.01. For box plots shown in (a, b, f, j), the center line represents the median; the bounds of the box indicate the 25th and 75th percentiles; and the whiskers extend to the minimum and maximum values. Source data are provided as a Source Data file.
To reduce the influence of sex and age on protein calculations associated with disease activity, we adjusted for age and sex in subsequent analyses. Through multiple linear modeling, we initially identified the proteins associated with DAS28-CRP. Among these proteins, more were negatively correlated with DAS28-CRP (Fig. 3g). Proteins positively correlated with DAS28-CRP, such as CRP, LRG1, ORM1, SERPINA4, and C9, were primarily associated with the acute-phase response and immune system. Conversely, the proteins that were negatively correlated with DAS28-CRP were involved mainly in biosynthesis and metabolism (Fig. 3h and Supplementary Fig. 2b). We further performed correlation analysis based on specific DAS28-CRP parameters (Fig. 3i). Among the proteins most significantly correlated with the clinical parameters, SERPINA3, LRG1 and HP were positively correlated with CRP, whereas ACOX1 and LRG1 were positively correlated with the swollen joint count (SJC). Moreover, HSD17B10 and RPL23A were negatively correlated with visual analogue scale (VAS) and TJC, respectively (Fig. 3i). ACPA-negative RA exhibited a consistent positive correlation between an intensified immune response and DAS28-CRP. Unexpectedly, almost no proteins were negatively correlated with DAS28-CRP or its four parameters (Supplementary Fig. 2c–f).
Due to differences in DAS28-CRP scores between ACPA-positive females under and over 45 years old, we investigated the impact of age on disease activity in this group. Overlap analysis of proteins associated with both age and DAS28-CRP was conducted (Fig. 3j). We found that CRP, SERPINA3, SAA2, and HP levels increased with age and were positively correlated with disease activity. Conversely, A2M, AHSG, and TF decreased with age and were negatively related to disease activity, highlighting the specific impact of aging on disease progression. Additionally, APOC3, RBP4, FN1 and NCL increased with age but were negatively correlated with disease activity. The age-related increase in these protective proteins warrants further investigation to understand the underlying mechanisms involved.
Decipher nonlinear proteomic fluctuations across DAS28-CRP
The relationship between plasma proteins and DAS28-CRP is intricate, extending beyond linear associations. To decode the complexity of proteomic dynamics fluctuating with DAS28-CRP, the most important parameter for assessing disease activity, two strategies have been applied.
First, to investigate proteomic differences based on clinical classification, we divided ACPA-positive RA patients into four groups based on DAS28-CRP: (I) remission (<2.6), (II) low (2.6–3.2), (III) moderate (3.2–5.1), and (IV) high (>5.1)39. To reduce the complexity inherent in the proteome, we used unsupervised hierarchical clustering to group proteins with similar trajectories, resulting in six distinct clusters (Fig. 4a). Proteins associated with acute-phase responses, innate immunity, and neutrophil activity displayed increasing trends as disease activity increased in Clusters3. In Cluster6, proteins involved in carbon metabolism, IGF transport, and glycolysis consistently decreased with increasing DAS28-CRP. Proteins in Cluster5 and Cluster2, which are involved in pyruvate metabolism, ROBO signaling, and translation-related processes, initially increased from remission to low activity and then decreased. Notably, the fluctuations in complement in Cluster1 and Cluster4 suggest a dynamic balance between the activation and consumption of complement components as disease activity levels change. A similar analysis of ACPA-negative RA patients revealed differences from ACPA-positive RA patients. ACPA-negative RA patients generally presented increased innate immune activity that decreased with increasing disease activity, weakened adaptive immune responses such as antigen presentation and T-cell receptor signaling, and a notable increase in amino acid metabolism and axon guidance (Supplementary Fig. 3). Overall, these results indicate that some plasma protein changes with increasing DAS28-CRP are nonlinear.
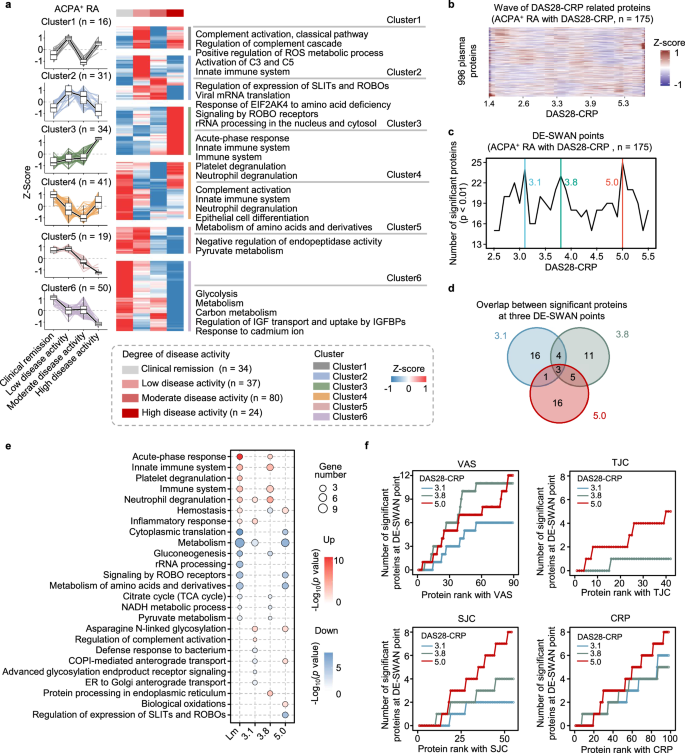
a Unsupervised k-means clustering analysis of DEPs across four disease activity groups (two-sided Student’s t test, p < 0.05). The expression patterns of disease-related proteins in distinct clusters are shown on the left, with enriched pathways (more than 5 proteins) for each cluster on the right (two-sided Fisher’s exact test). Box plots inside showing the median (center line), the 25th and 75th percentiles (bounds of box), and the minimum and maximum values (whiskers). b Heatmap visualizing protein trajectories across DAS28-CRP. The trajectories of 996 proteins are estimated using LOESS. c The number of DEPs across disease activity levels. DE-SWAN identified three local peaks at DAS28-CRP values of 3.1, 3.8, and 5.0. d Overlap of proteins with significant differential expression at the three local peaks. e Bubble plot visualizing the enriched pathways of significant proteins identified through linear regression with DAS28-CRP and at three peaks in DE-SWAN (two-sided Fisher’s exact test, p < 0.05). f Line plot visualizes the results of the linear regression analysis of proteins (significant at DAS28-CRP values of 3.1, 3.8, and 5.0 in DE-SWAN) with VAS, TJC, SJC, and CRP. The cumulative number of overlapped proteins that are significant either at DE-SWAN points or in relation to the four parameters is shown, with proteins ranked based on significance from the linear regression models (adjusted for age and sex, two-sided p value < 0.05). Source data are provided as a Source Data file.
Second, given the nonlinear trends of most proteins across DAS28-CRP, as visualized by locally estimated scatterplot smoothing (LOESS)-estimated trajectories (Fig. 4b), we used DE-SWAN analysis to capture localized fluctuations at a smaller scale40. We analyzed protein levels within a 40-sample window, comparing two groups within segments of 20 samples and incrementally sliding the window by 0.1 DAS28-CRP values from low to high disease activity. This analysis identified three key peaks at DAS28-CRP scores of 3.1, 3.8, and 5.0, revealing waves of protein level changes corresponding to these DAS28-CRP values (Fig. 4c, d). The peaks were related to distinct sets of proteins. At a DAS28-CRP score of 3.1, upregulated innate immune functions, such as complement activation and neutrophil degranulation, were observed, alongside inhibited anterograde transport. At a DAS28-CRP score of 3.8, inflammatory pathways were further upregulated, with impaired glucose metabolism. A DAS28-CRP score of 5.0 indicated elevated oxidative stress, with reduced ROBO signaling and protein metabolism (Fig. 4e). These dynamic and nonlinear changes in DAS28-CRP-associated proteins suggest that treatment strategies should be tailored to target specific proteins at different levels of disease activity.
Moreover, we assessed the correlations between the four components of DAS28-CRP and the proteins identified at the three peaks. Proteins correlated with the VAS significantly overlapped with DEPs at DAS28-CRP 3.8 and 5.0, while proteins related to other parameters showed greater overlap with DEPs at DAS28-CRP 5.0 (Fig. 4f). These findings suggest that the DAS28-CRP-related proteome exhibits distinct associations with different disease activity parameters.
Proteomic signatures for predicting treatment response via machine learning
MTX-based csDMARDs therapy is the first-line treatment, but the response rates to various combinations are not consistent. An in-depth analysis of the treatment response of longitudinal cohorts to csDMARDs is essential but remains unexplored. To address this issue, we used follow-up data from 206 patients treated with various csDMARDs. Subsequent assessments, following the European League Against Rheumatism (EULAR) criteria, were conducted after a period of more than three months41 (Supplementary Fig. 4a, b). We focused on the MTX + LEF (n = 89) and MTX + HCQ (n = 64) groups because of their adequate sample sizes for statistical analysis. RA patients with clinical remission and low disease activity were excluded because those with moderate to high disease activity were more likely to respond to treatment (Supplementary Fig. 4c, d). The age and sex differences between responders and non-responders were not significant in either group (Supplementary Fig. 4e, f). Initially, we conducted differential analyses between responders and non-responders without considering sex and age effects. In patients responsive to MTX + LEF treatment, there were increased proteins related to immunity and energy metabolism, alongside decreased proteins related to lipid oxidation (Fig. 5a–c). In patients responsive to MTX + HCQ treatment, we detected elevated protein levels associated with metabolism, immunity, and toll-like receptor cascades, and reduced protein levels associated with transport pathways (Fig. 5d–f). Furthermore, we analyzed these differences between responders and non-responders in the ACPA-positive RA group, which had a sufficient sample size for statistical analysis. MTX + LEF responders showed increased complement activation, fibrinolysis, and autophagy, with downregulated metabolic and glycolytic pathways (Supplementary Fig. 5a, b), while MTX + HCQ responders exhibited upregulated immune activation and downregulated mitochondrial transport pathways (Supplementary Fig. 5c, d). Given that sex may affect treatment response42, we also examined its impact on response-related proteomics. In female responders to MTX + LEF, we observed elevated protein transport and inflammatory pathways, while male responders showed increased endocytosis (Supplementary Fig. 5a, b). Among the MTX + HCQ responders, females presented increased nonsense-mediated decay and decreased amino acid metabolism (Supplementary Fig. 5c, d).
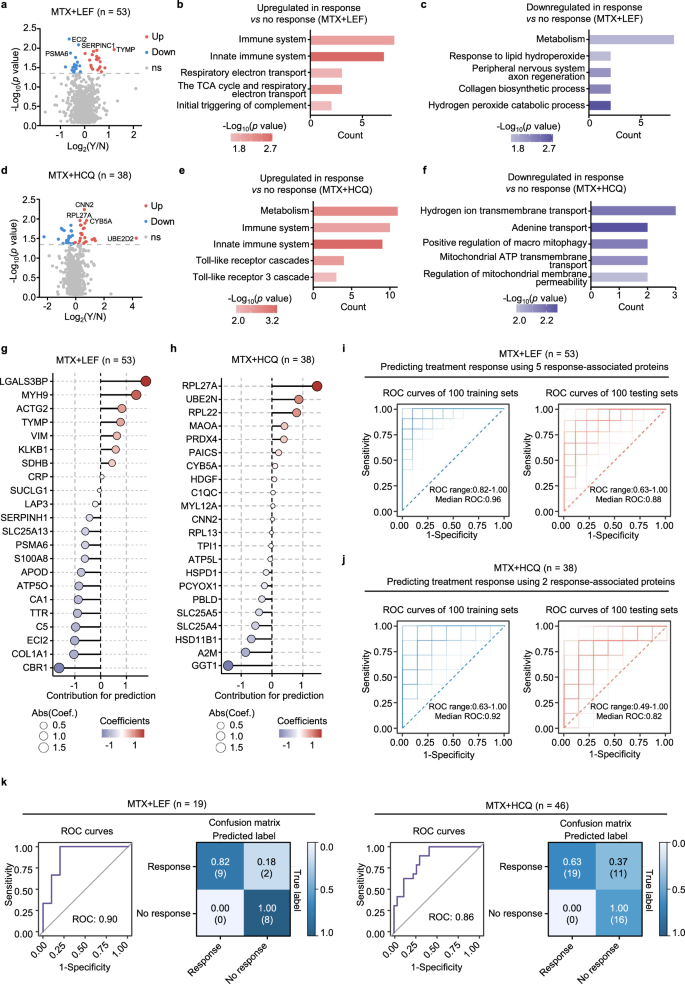
a Volcano plot of DEPs between response and no response to MTX + LEF treatment (two-sided Student’s t test, p < 0.05). Y = response, N = no response. Enrichment analysis of upregulated (b) and downregulated (c) proteins in response vs no response to MTX + LEF treatment (two-sided Fisher’s exact test, p < 0.05). d Volcano plot of DEPs between response and no response to MTX + HCQ treatment (two-sided Student’s t test, p < 0.05). Y = response, N = no response. Enrichment analysis of upregulated (e) and downregulated (f) proteins in response vs no response to MTX + HCQ treatment (two-sided Fisher’s exact test, p < 0.05). LASSO regression analysis showing the contribution of DEPs to treatment response prediction in the MTX + LEF (g) and MTX + HCQ (h) groups. ROC curves illustrating the predictive performance of the LASSO model for MTX + LEF (i) and MTX + HCQ (j) responses, using the top 5 or 2 proteins, respectively, in both the training (left) and testing (right) sets, with 10-fold cross-validation repeated 100 times. k ROC curve showing model performance after integrating protein levels measured by ELISA. The confusion matrix displays sensitivity and specificity at the optimal cutoff for the MTX + LEF (left) and MTX + HCQ (right) groups. Source data are provided as a Source Data file.
Furthermore, we developed models using plasma proteins to predict treatment response. By employing least absolute shrinkage and selection operator (LASSO) feature selection on characteristic proteins, we constructed linear regression models and calculated the contribution scores of these proteins to the models. Proteins with absolute contribution values greater than 1 were ultimately selected for model construction (Fig. 5g, h). We ensured equal numbers of responders and on-responders in both the training and testing sets. After 10-fold cross-validation to determine the optimal regularization parameter, we performed 100 iterations to generate an average receiver operating characteristic (ROC) curve, ensuring stable and reliable predictions (Supplementary Fig. 6a). In the model for predicting the MTX + LEF treatment response, five proteins were used, with LGALS3BP and MYH9 increased in responders, while ECI2, COL1A1, and CBR1 decreased in responders. For the MTX + HCQ treatment, RPL27A was a positive predictor and GGT1 was a negative predictor. The LASSO-selected proteins predictors all ranked within the top 10 across multiple other feature selection methods (random forest, recursive feature elimination combined with support vector machine, XGBoost, stability selection and elastic net), supporting their robustness (Supplementary Fig. 6b). Cross-validation yielded an average ROC of 0.96 for the training set and 0.88 for the testing set in MTX + LEF treatment groups (Fig. 5i). The predictive ROC values were 0.92 for training and 0.82 for testing in MTX + HCQ treatment groups (Fig. 5j). SHAP analysis was performed to interpret the contribution of individual proteins to the predictive models, confirming that their effect directions were consistent with those identified by feature selection (Supplementary Fig. 6c). In addition, we built prediction models with random forest and XGBoost using LASSO-identified features, but their median ROC values remained lower than those from LASSO (Supplementary Fig. 6d, e). These findings consistently highlight the superior predictive performance of LASSO. Furthermore, incorporating DAS28-CRP parameters (VAS, SJC, TJC, and CRP) into the protein features slightly improved the predictive performance, with median ROC values of 0.90 (vs. 0.88) for MTX + LEF and 0.84 (vs. 0.82) for MTX + HCQ in the testing sets (Supplementary Fig. 6f).
We validated our model performance in an independent cohort of 46 RA patients receiving MTX + HCQ and 19 patients receiving MTX + LEF. The enzyme-linked immunosorbent assay (ELISA) results revealed consistent biomarker changes with proteomic data between responders and non-responders (Supplementary Fig. 6g). Integrating these protein levels into our model maintained strong classification efficiency, with ROC values of 0.90 for MTX + LEF and 0.86 for MTX + HCQ. Using a confusion matrix to determine the optimal cutoff, the MTX + LEF model successfully identified 9 out of 11 responders with no false negatives. In contrast, the MTX + HCQ model exhibited a sensitivity of 0.63 and specificity of 1.0, which may be influenced by the smaller discovery cohort size (Fig. 5k). Overall, both LASSO models demonstrated robust predictive performance and can accurately predict treatment responses for the two most common MTX combination therapies, offering valuable insights for personalized treatment strategies.
Proteomic changes after treatment in RA patients who respond
To investigate the proteomic changes after MTX + LEF or MTX + HCQ treatment in RA patients who responded, differential analyses were performed (Fig. 6a, b). We found that retinol metabolism and cytoplasmic translation increased, whereas actin cytoskeleton and acute-phase responses decreased in responders after MTX + LEF treatment (Fig. 6a, c). In contrast, mRNA metabolism, retinol metabolism and cell adhesion increased, while the complement pathway decreased in responders after MTX + HCQ treatment (Fig. 6b, d). Notably, these pathways did not show pronounced changes in non-responders following either treatment (Fig. 6e, f and Supplementary Fig. 7a, b).
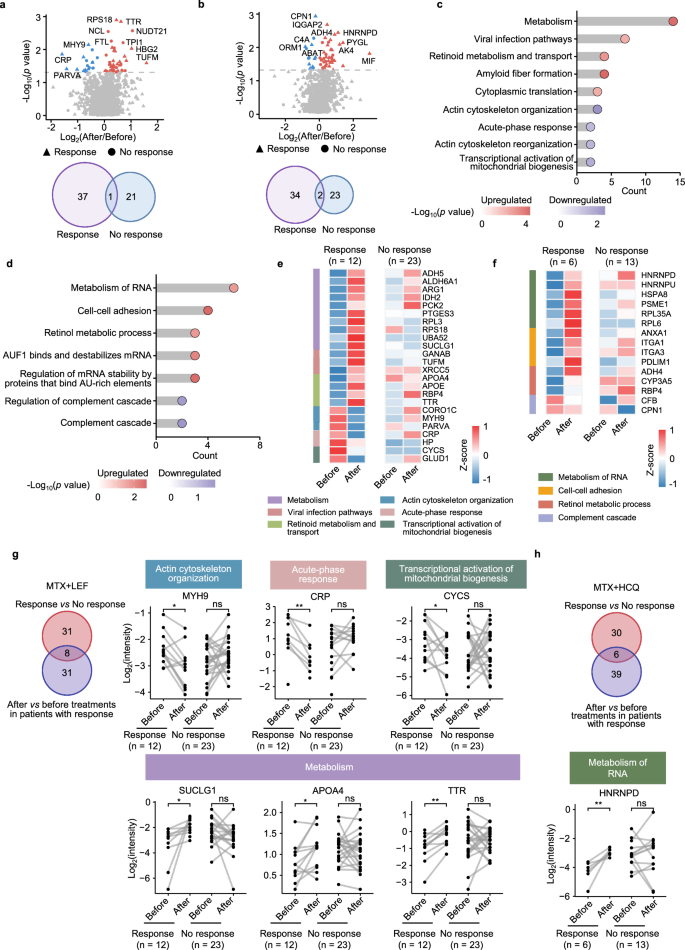
a Volcano plots showing DEPs before and after MTX + LEF treatment, stratified by treatment response (response, n = 12; no response, n = 23) (paired two-sided Student’s t test, p < 0.05). b Volcano plots showing DEPs before and after MTX + HCQ treatment, stratified by treatment response (response, n = 6; no response, n = 13) (paired two-sided Student’s t test, p < 0.05). c Pathway enrichment analysis of DEPs before and after MTX + LEF treatment in response (two-sided Fisher’s exact test). d Pathway enrichment analysis of DEPs before and after MTX + HCQ treatment in response (two-sided Fisher’s exact test). e Heatmap of the relative abundance of DEPs before and after MTX + LEF treatment, separated by response. f Heatmap of the relative abundance of DEPs before and after MTX + HCQ treatment, separated by response. Venn diagrams displaying overlap of treatment- and response-related proteins for MTX + LEF (response, n = 12; no response, n = 23) (g) and MTX + HCQ (response, n = 6; no response, n = 13) (h) therapies, grouped by response, with corresponding dot plots illustrating the differential expression of these proteins among groups (paired two-sided Student’s t test). Significance is indicated as follows: *p < 0.05, **p < 0.01, ns means p ≥ 0.05. Source data are provided as a Source Data file.
To identify pivotal factors contributing to pharmacological efficacy, we performed overlapping analysis between proteins associated with treatment response and those significantly changed after csDMARDs treatment. In the MTX + LEF group, eight common proteins involved in the acute response, actin cytoskeleton organization, mitochondrial biogenesis activation and metabolism were identified (Fig. 6g). In the MTX + HCQ group, six overlapping proteins were identified (Fig. 6h). These proteins may serve as potential targets for these two csDMARDs therapies.
Besides, we explored the effects of sex and ACPAs status on treatment-induced proteomic changes. Due to the limited number of ACPA-negative RA patients receiving both treatments and the limited number of males receiving MTX + HCQ treatment, these patients were not included in the analysis. In ACPA-positive RA patients receiving MTX + LEF, translation, amino acid metabolism, and axon guidance were increased. After MTX + LEF treatment, female responders presented elevated protein and RNA metabolism, whereas male responders showed increased actin cytoskeleton regulation (Supplementary Fig. 7c–e). In contrast, after MTX + HCQ treatment, RNA metabolism and axon guidance increased in ACPA-positive responders (Supplementary Fig. 7f, g). Our analysis indicates that sex has a certain impact on csDMARDs therapy-induced proteomic changes.

