Macrophage-derived piENOX2 plays an important role in the onset and progression of RA
In the CIA model established in DBA1/J mice, synovial tissue piRNA expression was compared between diseased mice and healthy controls (Fig. 1a). The top ten most significantly upregulated or downregulated piRNAs were identified through comparative analysis of human and mouse sequences (Fig. 1b–d). RT–qPCR confirmed the expression trends of six piRNAs in the synovial tissues of patients with RA (Fig. 1e, f). Mimics and inhibitors for these piRNAs were synthesized, and their impact on proinflammatory cytokine expression (IL-1β, IL-6 and TNF) was verified in an LPS-induced RAW 264.7 cell inflammatory model (Fig. 1g, h). Notably, the piRNA-72187 mimic significantly increased the levels of proinflammatory cytokines, while the piRNA-72187 inhibitor suppressed these levels.
a The piRNA expression in each sample was analyzed using the Illumina HiSeq 2500 system (N = 5). The CIA mouse model was constructed, and hind-limb knee joint synovial tissue samples were collected at predetermined time points for total RNA extraction. b–d A cluster analysis and expression profiling of the top ten human–mice homologous piRNAs with the most significant upregulation and downregulation. e, f RT–qPCR was used to detect the expression of these piRNAs in the synovial tissue of patients with RA; in the LPS-induced inflammation model, piRNA mimics (g) and inhibitors (h) were used to overexpress and inhibit the expression of corresponding piRNAs, respectively, and RT–qPCR was performed to measure the levels of TNF, IL-1β and IL-6. The synovial tissue samples from the affected joints of CIA mice were isolated, and single-cell suspensions were prepared through enzymatic hydrolysis. i, The key cell populations in the synovial tissue, including synovial macrophages (CD45+CD14+), T cells (CD45+CD3+), B cells (CD45+CD3−CD19+) and fibroblasts (CD45−PDPN+), were sorted and collected via flow cytometry. j, RT–qPCR analysis of piENOX2 expression in individual cell populations (N = 6). k The distribution and colocalization of piENOX2 and synovial macrophages (CD68+) in the synovial tissue of patients with RA were observed using FISH. l The distribution and colocalization of piENOX2 and fibroblasts (CD90+) in the synovial tissue of patients with RA were observed using FISH. * P< 0.05, ** P< 0.01, *** P< 0.001.
piRNA-72187, which originates from the Enox2 gene, was designated as piENOX2. Using RNA pulldown, proteins binding to piENOX2 were enriched and isolated. Camas brilliant blue staining revealed a distinct band at 98 kD (Supplementary Fig. 1a), while electrophoresis confirmed the presence of PIWI-1 and PIWI-4 among the enriched proteins (Supplementary Fig. 1b), verified by protein profiling (Supplementary Fig. 1c–e). RNA coimmunoprecipitation–qPCR confirmed the presence of piENOX2 expression in the RNA bound to PIWI-1 and PIWI-4 (Supplementary Fig. 1f). Molecular docking simulations confirmed piENOX2 binding to PIWI-1 and PIWI-4 (Supplementary Fig. 1g,h), verifying the identity of the small RNA as piRNA.
Flow cytometry and FISH identified macrophages as the primary source of piENOX2 in synovial tissue. Flow cytometry was used to sort fibroblasts (CD45−PDPN+), macrophages (CD45+CD14+), T cells (CD45+CD3+) and B cells (CD45+CD3−CD19+) (Fig. 1i and Supplementary Fig. 2a). The RT–qPCR results indicated significantly higher piENOX2 expression in macrophages (Fig. 1j). FISH analysis further demonstrated a pronounced colocalization of piENOX2 with macrophages (CD68+) (Fig. 1k). Conversely, the expression of piENOX2 was minimal in fibroblasts (CD90+) without significant colocalization (Fig. 1l). These results suggest that macrophages are the main source cells of piENOX2.
Synovial tissue samples from patients with RA and controls were analyzed (Supplementary Fig. 2b,c). Hematoxylin and eosin staining revealed hyperplasia of synovial tissue in patients with RA (Supplementary Fig. 2d). The immunohistochemistry (IHC) and Immunofluorescence (IF) results showed elevated levels of the proinflammatory cytokines IL-1β, IL-6 and TNF in RA synovial tissue (Supplementary Fig. 2e–h), while FISH indicated increased piENOX2 expression in RA synovial tissue (Fig. 2a, b). RT–qPCR measurements confirmed the presence of significantly higher piENOX2 expression in RA synovial tissue (Fig. 2c). The DAS-28 was employed to assess the disease activity of patients with RA. Pearson correlation analysis revealed a significant positive association between DAS-28 scores and the expression level of piENOX2 (Fig. 2d). Flow cytometry analysis showed that the piENOX2 mimic (piENOX2 MIM) inhibited macrophage M2 polarization, decreasing F4/80+CD206+ cells, while the piENOX2 inhibitor (piENOX2 INH) facilitated M2 polarization (Fig. 2e, f). Western blotting of M2 macrophage markers (ARG1, TGF-β and IL-10) showed that piENOX2 MIM suppressed and piENOX2 INH enhanced their protein expression (Fig. 2g, h). In the LPS-induced macrophage M1 polarization model, piENOX2 MIM promoted M1 polarization, increasing the number of F4/80+CD86+ cells, while this was suppressed by piENOX2 INH (Fig. 2i, j). Western blotting confirmed that piENOX2 MIM upregulated and piENOX2 INH downregulated M1 macrophage markers (iNOS, IL-1β, IL-6 and TNF) (Fig. 2k,l).
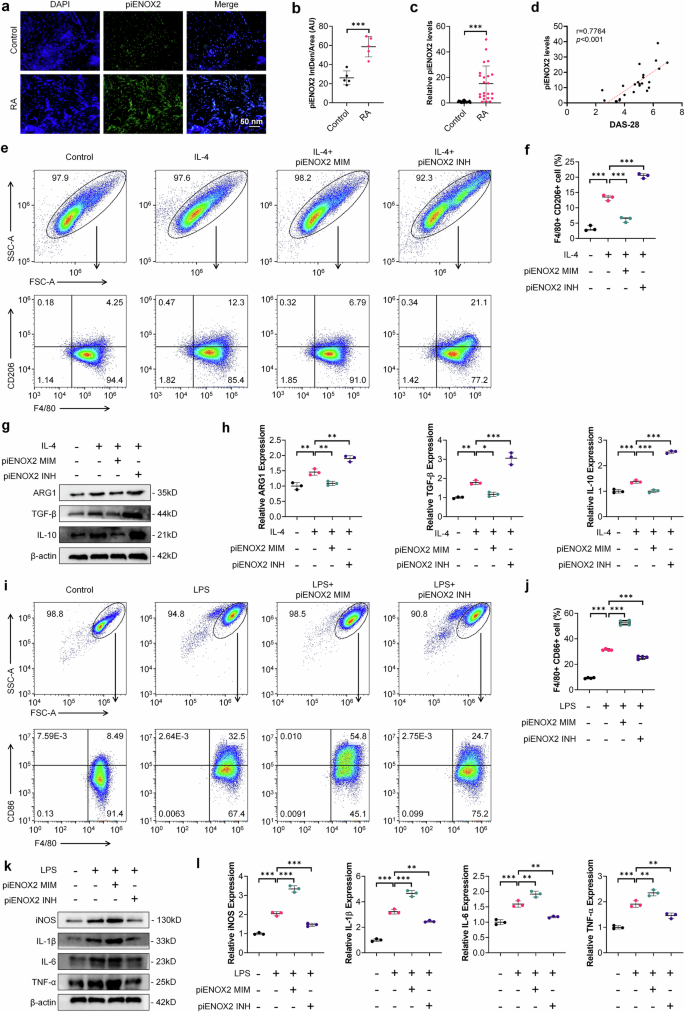
a FISH observation of piENOX2 expression and distribution in the synovial tissue of patients with RA and control patients. b Semiquantitative analysis of piENOX2 fluorescence intensity in different samples using ImageJ (arbitrary units (AU)). c RT–qPCR detection of piENOX2 expression in the synovial tissue of patients with RA and controls (Ncontrol = 20, NRA = 23). d A Pearson correlation analysis was performed to evaluate the association between DAS-28 scores and piENOX2 expression levels (N = 24). e, f Flow cytometry (e) and quantitative analysis (f) of the regulatory effects of piENOX2 MIM and piENOX2 INH on IL-4-induced M2 polarization (N = 3). g, h Western blotting (g) showing the regulatory effects of piENOX2 MIM and piENOX2 INH on the expression of M2 macrophage markers and their secreted cytokines, including ARG1, TGF-β and IL-10, with semiquantitative analysis (h) performed using ImageJ (N = 3). i, j Flow cytometry (i) and quantitative analysis (j) of the regulatory effects of piENOX2 MIM and piENOX2 INH on LPS-induced M1 polarization (N = 4). k, l Western blot analysis (k) of the regulatory effects of piENOX2 MIM and piENOX2 INH on the expression of M1 macrophage markers and their secreted cytokines, including iNOS, IL-1β, IL-6 and TNF, with semiquantitative analysis (l) performed using ImageJ (N = 3). *P < 0.05, **P < 0.01, ***P < 0.001.
These findings suggest that macrophage-derived piENOX2 promotes macrophage M1 polarization and upregulates proinflammatory cytokines, while its inhibition promotes macrophage M2 polarization, inhibiting inflammation.
Macrophage-targeted piENOX2 INH liposome prodrug (Man/LNP@piENOX2 INH) effectively alleviates disease progression in CIA mice
To verify the in vivo therapeutic efficacy of piENOX2 INH in CIA mice, we used liposomes as the drug carrier for piENOX2 INH, employing mannose (Man) for macrophage-targeted delivery21. Lipid nanoparticles (LNPs) are known to be superior carriers for small RNA drugs22. The synthesized LNPs were composed of SM-102 (50%), DSPC (10%), cholesterol (38.5%) and DMG-PEG2000 (1.5%) (Fig. 3a). The overall encapsulation efficiency for piENOX2 INH was 90.6%, with a concentration of 1323 ng μl−1. Characterization of the intermediate and final products indicated a hydrated particle size of LNP@piENOX2 INH of 99.39 nm, with a polymer dispersity index of 0.05744 and a zeta potential of 8.747 mV (Supplementary Fig. 3a,b). The hydrated particle size of Man/LNP@piENOX2 INH was approximately 114.3 nm, with a polymer dispersity index of 0.1022 and a zeta potential of −1.139 mV (Supplementary Fig. 3c,d). Transmission electron microscopy confirmed the spherical shape of Man/LNP@piENOX2 INH, with a particle size of about 97.7 nm (Fig. 3b). The targeting ability of ICG–Man/LNP@piENOX2 INH was verified using a small animal in vivo imaging system. Strong fluorescence signals were observed in the joints and claws of mouse limbs after 12 h, which were reduced 48 h while remaining detectable. By 96 h, the fluorescence signal had weakened significantly and nearly disappeared, indicating effective targeting and accumulation of Man/LNP@piENOX2 INH in the affected joint areas (Fig. 3c).
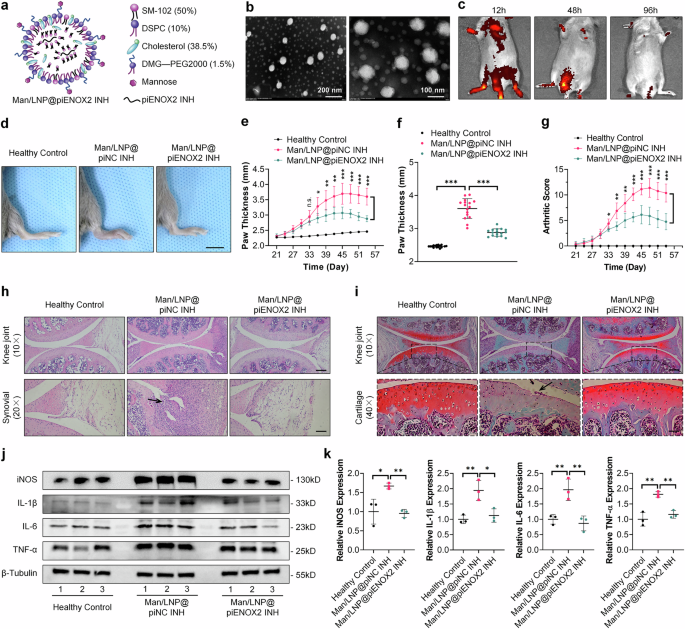
a The construction of Man/LNP@piENOX2 INH. b TEM image of Man/LNP@piENOX2 INH. c The tissue distribution of ICG-labeled Man/LNP@piENOX2 INH in CIA mice, observed via small animal in vivo imaging at predetermined time points following tail vein injection. d Photographs of hind paws in each group of mice; scale bar, 10 mm. e Trend of changes in hind-paw thickness over the treatment period. f Final measured hind-paw thickness in each group. g Trends in arthritis scores of mice in each group throughout the treatment period. h A hematoxylin and eosin staining showing joint morphology and synovial infiltration in each group of mice; scale bars, 200 μm at 10× and 100 μm at 20× magnification. i Safranin-O and Fast Green staining indicating joint cartilage damage in each group of mice; scale bars, 200 μm at 10× and 50 μm at 40× magnification. j, k The protein expression levels of iNOS, IL-1β, IL-6 and TNF in the synovial tissue of each group of mice, detected by western blotting (j), with semiquantification (k) using ImageJ (N = 3). *P < 0.05, **P < 0.01, ***P < 0.001.
We systematically verified the therapeutic efficacy of Man/LNP@piENOX2 INH in CIA mice (Supplementary Fig. 3e). Man/LNP@piENOX2 INH did not induce structural or functional changes in various organs (Supplementary Fig. 3f). Analysis of paw swelling revealed significant reductions throughout the treatment cycle for mice in the Man/LNP@piENOX2 INH group, while the control group exhibited substantial swelling (Fig. 3d, f). Arthritis scores indicated effective alleviation of inflammatory symptoms in the Man/LNP@piENOX2 INH group compared with the controls (Fig. 3g).
Histological evaluations (hematoxylin and eosin, Safranin-O and Fast Green) demonstrated that Man/LNP@piENOX2 INH effectively inhibited synovial tissue proliferation and infiltration in the affected joints (Fig. 3h and Supplementary Fig. 3g). The loss of proteoglycans in the affected cartilage was alleviated in the treatment group, with maintenance of an intact articular surface and protection of chondrocyte counts and cartilage thickness (Fig. 3i and Supplementary Fig. 3h). The IHC results showed that Man/LNP@piENOX2 INH inhibited catabolism and enhanced anabolism in cartilage (Supplementary Fig. 3i). Micro-Computed Tomography (Micro-CT) data indicated that Man/LNP@piENOX2 INH effectively mitigated bone loss in affected joints (Supplementary Fig. 3j).
Flow cytometry was used to evaluate the impact of Man/LNP@piENOX2 INH on immune regulation. CIA mice showed elevated CD4+ T cell numbers, with reduced proportions of CD8+ T cells, increased IL-17A+ T cells (Th17 cells) and decreased Foxp3+ T cells (Treg). In the treatment group, the CD4+/CD8+ ratio was restored to normal levels23, accompanied by increased Treg and reduced Th17 cells, reinstating immune homeostasis (Supplementary Fig. 4a,b). Enzyme linked immunosorbent assay (ELISA) results indicated a significant reduction in the serum levels of proinflammatory cytokine in the treatment group (Supplementary Fig. 4c). Although IL-10 levels in CIA mice were not significantly different from those in healthy controls, the treatment group showed significantly increased IL-10 concentrations. Western blotting showed that Man/LNP@piENOX2 INH inhibited IL-1β, IL-6 and TNF expression in synovial tissue (Fig. 3j, k). IHC results conformed these findings, showing reduced expression of these cytokines in articular cartilage and synovial tissue (Supplementary Fig. 4d).
In summary, Man/LNP@piENOX2 INH was observed to protect the structural integrity of articular cartilage, while maintaining immune homeostasis, suppressing inflammation and slowing disease progression in CIA mice.
piENOX2 regulates macrophage polarization by targeting Alkbh5 mRNA
Recent investigations have highlighted the regulatory functions of the piRNA/PIWI complex in modulating the expression of protein-coding genes through a mechanism involving complementary base pairing recognition24,25. At the molecular level, piRNA shares similarities with miRNA, functioning as a guide for AGO and PIWI proteins to target and cleave specific mRNA. To delve into the mechanistic intricacies of piENOX2, we utilized piRNA sequences, together with BLAST comparisons and screening using the piRBase and NCBI databases. Notably, we identified a piENOX2 recognition region on Alkbh5 mRNA (Fig. 4a). Molecular docking was used to investigate the binding sites among piENOX2, PIWI protein and Alkbh5 mRNA (Fig. 4b). We evaluated the regulatory impact of piENOX2 on Alkbh5 mRNA and protein expression using RT–qPCR and western blotting. The results showed that the piENOX2 MIM reduced Alkbh5 mRNA and protein levels, while the piENOX2 INH increased their expression (Fig. 4c, d). Further investigation in inflammatory cell models and the synovial tissue of CIA mice revealed significantly lower Alkbh5 mRNA levels in the LPS-induced RAW 264.7 inflammatory cells, while Alkbh5 mRNA levels were reduced in CIA mouse synovial tissue (Supplementary Fi. 5a,b). This suggests that heightened piENOX2 expression in the synovial tissue of inflammatory cell models and CIA mice may lead to targeted inhibition of Alkbh5 mRNA and protein expression.
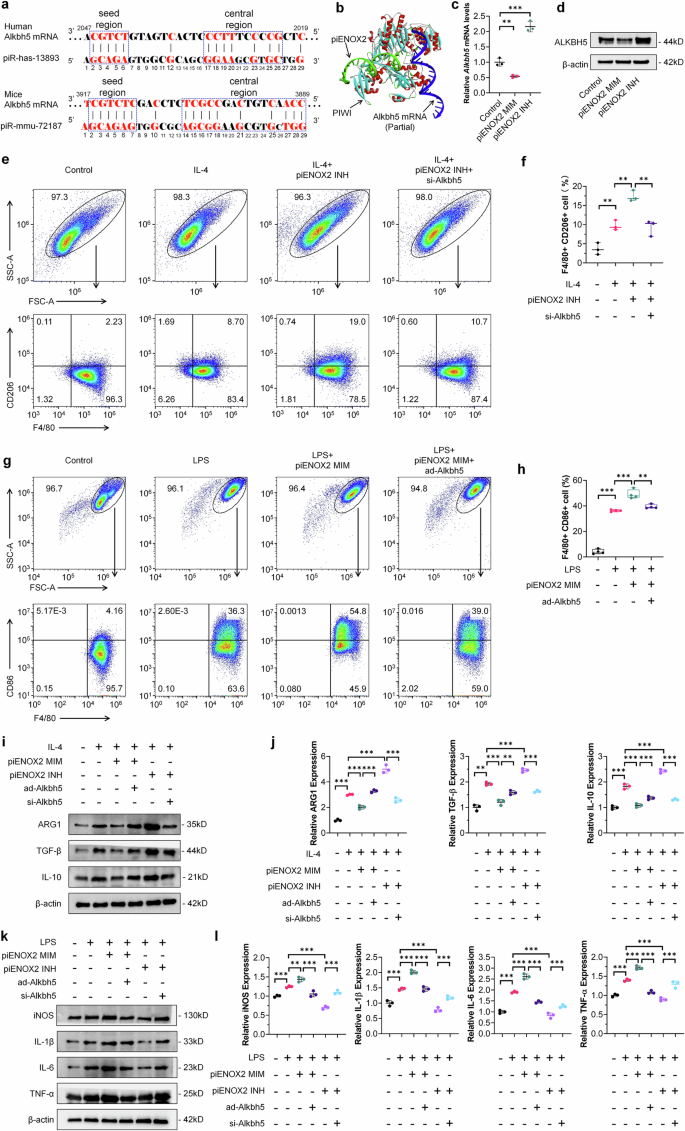
a Base complementarity between piENOX2 (human piRNA: piR-has-13893) and Alkbh5 mRNA in humans and mice. b A simulation of the binding between piENOX2, PIWI and Alkbh5 mRNA using visual molecular docking. c, d RT–qPCR (c) and western blots (d) showing the effects of piENOX2 MIM and piENOX2 INH on Alkbh5 mRNA and protein expression (N = 3). e, f Flow cytometry (e) and quantitative analysis (f) of the effect of Alkbh5 knockdown on piENOX2 INH-mediated promotion of M2 macrophage polarization (N = 3). g, h Flow cytometry (g) and quantitative analysis (h) of the effect of Alkbh5 overexpression on piENOX2 MIM-mediated promotion of M1 macrophage polarization (N = 4). i, j The evaluation of the effect of Alkbh5 overexpression or knockdown on piENOX2-regulated M2 macrophage polarization by western blot (i), with semiquantification (j) using ImageJ (N = 3). k, l The evaluation of the effect of Alkbh5 overexpression or knockdown on piENOX2-regulated M1 macrophage polarization by western blotting (k), with semiquantification (l) using ImageJ (N = 3). *P < 0.05, **P< 0.01, ***P< 0.001.
Subsequent exploration investigated the role of ALKBH5 in piENOX2-mediated regulation of macrophage polarization by overexpressing or knocking down ALKBH5 expression using an Alkbh5 overexpression adenovirus (ad-Alkbh5) and siRNA (si-Alkbh5) (Supplementary Fig. 5c,d). The flow cytometry results showed that knockdown of Alkbh5 inhibited the promacrophage M2 polarization effect of piENOX2 INH (Fig. 4e, f), while overexpression of Alkbh5 blocked the ability of piENOX2 MIM to promote macrophage M1 polarization (Fig. 4g, h). The western blotting results further showed that overexpression of Alkbh5 restored the expression of the M2 macrophage-related markers ARG1, TGF-β and IL-10 inhibited by piENOX2 MIM, while knockdown of Alkbh5 blocked the promoting effect of piENOX2 INH on the expression of M2 macrophage-related markers (Fig. 4i,j). By contrast, in the LPS-induced macrophage M1 polarization model, overexpression of Alkbh5 reduced the stimulatory effect of piENOX2 MIM on the expression of proinflammatory cytokines such as iNOS, IL-1β, IL-6 and TNF (Fig. 4k,l). Similarly, knockdown of Alkbh5 blocked the inhibitory effects of piENOX2 INH on the expression of proinflammatory cytokines.
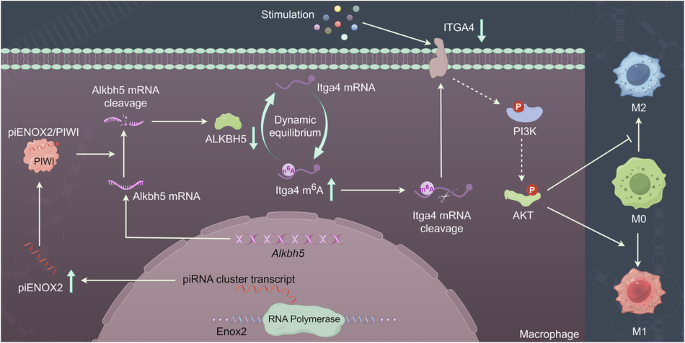
Collectively, these findings suggest that piENOX2/PIWI complex inhibits the expression of Alkbh5 mRNA through targeted degradation, thereby inducing M1 polarization and activation of macrophages.
The therapeutic efficacy of Man/LNP@piENOX2 INH is reduced in CIA model mice with myeloid-cell-specific-knockout of Alkbh5
To further confirm the involvement of ALKBH5 in piENOX2-mediated regulation of macrophage polarization and activation in mice, we established an Alkbh5 myeloid-cell-specific-knockout system using the Cre-loxP conditional-knockout approach (Lyz2-cre; Alkbh5flox/flox, Alkbh5 cKO) mice26,27,28 (Supplementary Fig. 5e–i). Subsequently, CIA mouse models were induced in both Alkbh5 cKO mice and control Alkbh5flox/flox mice, with each group undergoing drug treatment according to the established protocol. As depicted in Fig. 5a–d, within the control group featuring Alkbh5flox/flox mouse models, Man/LNP@piENOX2 INH significantly reduced hind-paw swelling and lowered arthritis scores in CIA mice compared with Man/LNP@piNC INH, effectively retarding disease progression in CIA mice. However, in the Alkbh5 cKO mouse model, the therapeutic effects of Man/LNP@piENOX2 INH resembled those of Man/LNP@piNC INH, with limited influence on the alleviation of hind-paw swelling and reducing arthritis scores (Fig. 5a–d). Moreover, the results of the histological analyses using hematoxylin and eosin and Safranin-O and Fast Green staining presented in Fig. 5e,f indicate that in the Alkbh5flox/flox mouse model, Man/LNP@piENOX2 INH preserved the structural integrity and function of the joints, reduced proliferation and infiltration of synovial tissue, and mitigated damage to the cartilage. Conversely, in the Alkbh5 cKO mouse model, the protective effects of Man/LNP@piENOX2 INH on reducing synovial tissue proliferation and preserving cartilage were decreased (Fig. 5e,f). The observations in the Alkbh5 cKO group mirrored the severe synovial tissue infiltration and cartilage destruction observed in the Man/LNP@piNC INH treatment group.
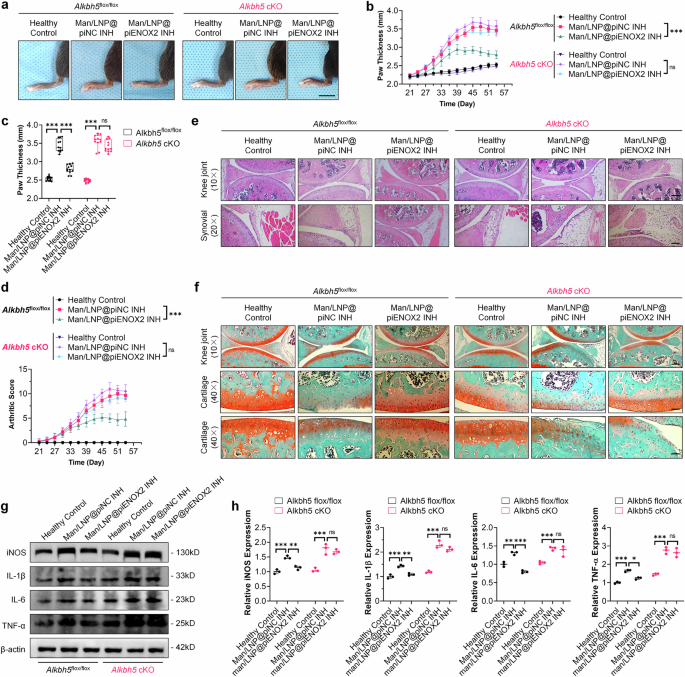
a An observation of swelling and redness in the hind paws of CIA mice in each treatment group at predetermined time points following treatment with different drugs; scale bar, 10 mm. b, c The trend of hind-paw thickness changes over the entire treatment period (b) and final measurement of hind-paw thickness in each group (c) (N = 6). d The trends in arthritis scores of mice in each group throughout the treatment period (N = 6). e Hematoxylin and eosin staining showing joint morphology and synovial infiltration in each group of mice; scale bars, 200 μm at 10× and 100 μm at 20× magnification. f Safranin-O and Fast Green staining indicating joint cartilage damage in each group of mice; scale bars 200 μm at 10× and 50 μm at 40× magnification. g, h Protein expression levels of iNOS, IL-1β, IL-6 and TNF in the synovial tissue of each group of mice, detected by western blotting (g), with semiquantification (h) using ImageJ (N = 3). A statistical analysis was conducted on data from day 54. ns, no significance; *P < 0.05, **P < 0.01, ***P < 0.001.
Consistent patterns were evident in the modulation of immune homeostasis and inflammation. In the CIA model of Alkbh5flox/flox mice, Man/LNP@piENOX2 INH demonstrated a noteworthy capacity to reduce excessive immune activation. This was manifested by the maintenance of the CD4+/CD8+ T lymphocyte ratio, downregulation of Th17 cell proportion and upregulation of the Treg proportion (Supplementary Fig. 6a,b). By contrast, in the CIA model of Alkbh5 cKO mice, the effects on maintenance of immune homeostasis and inhibition of inflammation maintenance and inflammation by Man/LNP@piENOX2 INH were markedly compromised. The proportions of CD4+/CD8+, Th17 and Treg cells in the Man/LNP@piENOX2 INH treatment group closely resembled those observed in the Man/LNP@piNC INH treatment group, with no significant differences (Supplementary Fig. 6a,b). Importantly, Man/LNP@piENOX2 INH failed to lower the expression of proinflammatory cytokines, including iNOS, IL-1β, IL-6 and TNF, within the affected articular synovial tissue of the CIA model of Alkbh5 cKO mice (Fig. 5g,h).
These findings indicate that the targeted knockout of Alkbh5 in macrophages attenuates the chondroprotective and immune regulatory effects of Man/LNP@piENOX2 INH in CIA model mice. This confirms the inhibitory role of ALKBH5 in Man/LNP@piENOX2 INH, contributing significantly to slowing the progression of CIA in the mice.
piENOX2 regulates ALKBH5-mediated m6A modification of Itga4 mRNA, thereby influencing macrophage polarization through the PI3K–AKT signaling pathway
ALKBH5 is a demthylase involved in m6A modifications and plays a pivotal role in preserving the dynamic equilibrium of m6A modifications within the body29,30,31,32. Based on previous data, meRIP-seq was used to investigate changes in m6A levels during piENOX2 regulation of macrophage polarization. Treatment with piENOX2 MIM or piENOX2 INH had no significant effects on the m6A site region (Supplementary Fig. 7a). Since piENOX2 can inhibit ALKBH5 expression, we identified 26 genes with increased m6A levels in the piENOX2 mimic group and decreased m6A levels in the piENOX2 inhibitor group (Supplementary Fig. 7b). Itga4, among these genes, is known to be associated with Extracellular Matrix (ECM)-receptor interactions and the PI3K–AKT pathway. KEGG analysis showed enrichment in these pathways for both piENOX2 MIM versus control and piENOX2 INH versus control groups (Supplementary Fig. 7c,d). The Integrated Genome Viewer results showed that compared with the control group, Itga4 mRNA had higher levels of m6A modification in the piENOX2 INH group and lower m6A levels in the piENOX2 MIM group. (Fig. 6a). meRIP–qPCR confirmed that piENOX2 MIM increased and piENOX2 INH decreased m6A levels of Itga4 mRNA (Fig. 6b). In addition, meRIP–qPCR further confirmed that ALKBH5 expression levels significantly influence the m6A methylation status of Itga4 mRNA (Supplementary Fig. 7e). Together, these findings support the notion that piENOX2 regulates the m6A modification of Itga4 mRNA by modulating ALKBH5 expression levels. RT–qPCR and western blotting showed that piENOX2 MIM downregulates and piENOX2 INH upregulated ITGA4 mRNA and protein levels (Fig. 6c,d). meRIP-seq analysis indicated that ITGA4 regulated macrophage polarization by piENOX2 via the PI3K–AKT pathway. To explore this, we used two effective Itga4 siRNAs (siITGA4-2 and siITGA4-3) (Supplementary Fig. 7f). In the LPS-induced model of M1 polarization, piENOX2 INH was found to activate the PI3K–AKT pathway, shown by increased phosphorylation of PI3K and AKT. Knockdown of Itga4 reduced this phosphorylation and inhibited the pathway activation by piENOX2 INH (Fig. 6e,f).
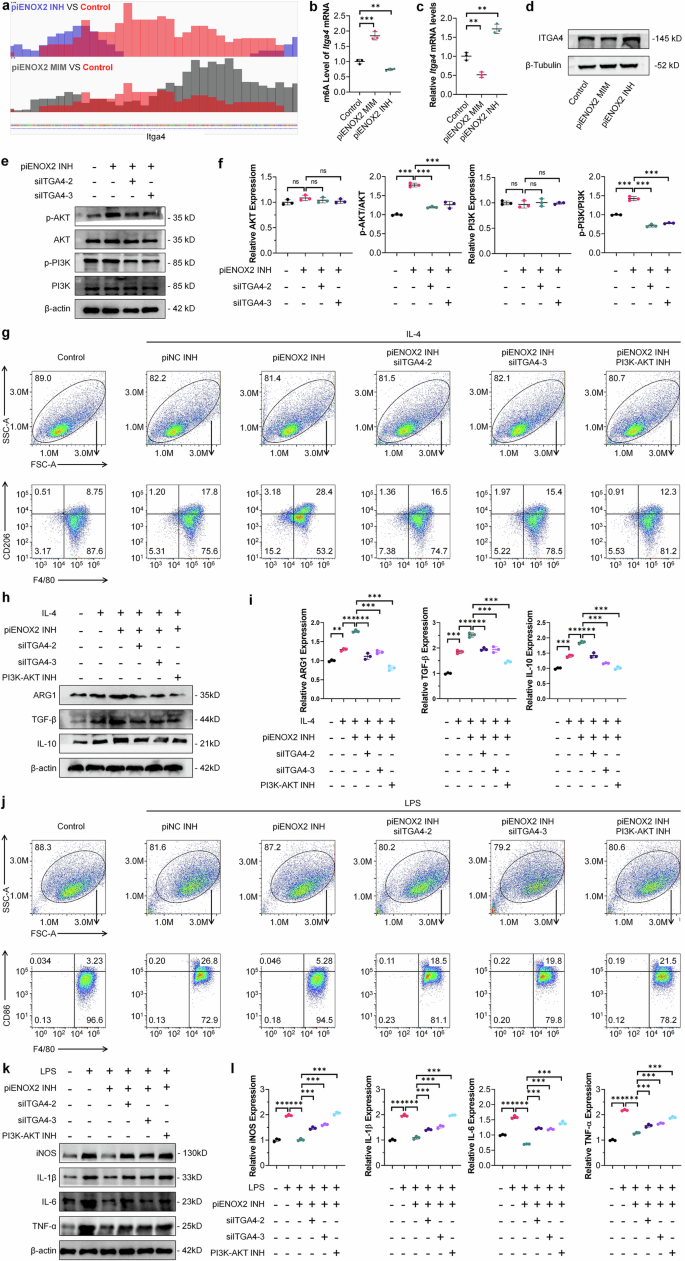
a An Integrated Genome Viewer visualization of the methylation level of Itga4 mRNA. b meRIP–qPCR detection of Itga4 m6A levels following treatment with piENOX2 MIM and piENOX2 INH (N = 3). c RT–qPCR detection of Itga4 mRNA expression after treatment with piENOX2 MIM and piENOX2 INH (N = 3). d Western blotting of ITGA4 protein expression after treatment with piENOX2 MIM and piENOX2 INH. e, f Western blotting (e) showing the effects of the effects of Itga4 knockdown on activation of the PI3K–AKT signaling pathway by piENOX2 INH, with semiquantification (f) using ImageJ (N = 3). g Flow cytometry analysis of the effects of Itga4 knockdown or blocking the PI3K–AKT signaling pathway on piENOX2 INH-promoted M2 macrophage polarization (N = 4). h, i Western blotting (h) showing the effects of Itga4 knockdown or blocking the PI3K–AKT signaling pathway on piENOX2 INH-promoted M2 macrophage polarization, with semiquantification (i) using ImageJ (N = 3). j Flow cytometry analysis of the effects of Itga4 knockdown or blocking the PI3K–AKT signaling pathway on piENOX2 INH-inhibited M1 macrophage polarization (N = 4). k, l Western blotting (k) showing the effects of Itga4 knockdown or blocking the PI3K–AKT signaling pathway on piENOX2 INH-inhibited M1 macrophage polarization, with semiquantification (l) using ImageJ (N = 3). ns no significance; **P< 0.01, ***P < 0.001.
To further understand the role of ITGA4, we blocked the pathway with siITGA4-2, siITGA4-3 and a PI3K–AKT inhibitor (PI3K–AKT INH). Flow cytometry showed piENOX2 INH promoted M2 polarization (Fig. 6g and Supplementary Fig. 7g). However, Itga4 knockdown or treatment with the PI3K–AKT INH blocked this effect. Western blotting confirmed that siITGA4 and PI3K–AKT INH reduced M2 markers such as ARG1, TGF-β and IL-10 (Fig. 6h,i). In the M1 model, piENOX2 INH inhibited M1 polarization, but siITGA4-2, siITGA4-3 and PI3K–AKT INH weakened this inhibition (Fig. 6j and Supplementary Fig. 7h). Western blotting also showed that blocking the PI3K–AKT pathway affected piENOX2 INH suppression of M1 markers (iNOS, IL-1β, IL-6 and TNF) (Fig. 6k,l).
In summary, piENOX2 was found to regulate ALKBH5-mediated m6A modification of Itga4 mRNA, which affects its mRNA stability and protein expression. This, in turn, influenced macrophage regulation through the PI3K–AKT signaling pathway.

