

Study selection
A total of 3362 articles were retrieved from six online databases. After excluding duplicates, 1746 articles remained. Subsequently, 1326 irrelevant studies were excluded based on the titles and abstracts. Next, following careful examination of the full texts of 420 articles, 388 were excluded. Ultimately, 32 articles were included in the study. The specific flow diagram is shown in Fig. 124,25,26,27,28,29,30,31,32,33,34,35,36,37,38,39,40,41,42,43,44,45,46,47,48,49,50,51,52,53,54,55.
Flow diagram of studies selection.
Characteristics of the included studies
A total of 41 independent experiments are detailed in the 32 studies, with specific information presented in Table 1. The drug used in 2 studies was CEL, 14 studies used TP, and 16 studies used TG. A total of 568 animals were involved, with 282 in the treatment group and 286 in the control group. Sprague–Dawley (SD) rats were used in 11 studies, Wistar rats in 8 studies, DA rats in 1 study, DBA/1 mice in 10 studies, C57BL/6 mice in 1 study, and Kunming mice in 1 study. Male animals were used in 25 studies, female animals in 5 studies, an equal mixture of male and female animals in 1 study, and 1 study did not report the sex of the animals. 22 studies employed bovine type II collagen for modeling, 6 studies utilized chicken type II collagen, and 4 studies used rat type II collagen. Pentobarbital anesthesia was used in 3 studies, chloral hydrate anesthesia in 3 studies, urethane anesthesia in 1 study, isoflurane in 1 study, and anesthesia method was not specified in 24 studies.
Quality assessment
Among the 32 included studies, except for 6 that were not randomly grouped, other studies mentioned random grouping, and 2 of them reported the random sequence generation process. All studies met the evaluation criteria of baseline characteristics between the groups. None of the studies reported allocation concealment and random housing. One study reported blinding of caregivers and experimental researchers. 17 studies did not describe the random methods for outcome assessment, while four studies mentioned blinded assessment of outcomes. 14 studies did not report complete outcome data. No selective outcome reporting was observed. The studies had no other sources of bias. The quality assessment result is shown in Table 2; Fig. 2.

Risk of bias graph for included studies.
Effectiveness
Primary outcome measures
Joint manifestations
The arthritis index (AI) was used as the outcome measure in 25 studies. A significant reduction in AI was observed in the Tripterygium wilfordii extracts groups (n = 448, WMD = -3.82, 95% CI: -4.41 to -3.23, p = 0.000; I2 = 91.9%, p = 0.000, Fig. 3A). Paw swelling degree was adopted as the outcome measure in four studies. Tripterygium wilfordii extracts also significantly reduced the paw swelling degree compared with the control group (n = 60, WMD = -0.28, 95% CI: -0.42 to -0.14, p = 0.000; I2 = 89.0%, p = 0.0000, Fig. 3B). Besides, six studies assessed paw thickness as an outcome measure. Tripterygium wilfordii extracts groups had a significant reduction on paw thickness (n = 90, WMD = -0.94, 95% CI: -1.40 to -0.47, p = 0.000; I2 = 90.5%, p = 0.000, Fig. 3C). Sensitivity analyses of these three outcomes showed stable results by excluding animal studies one by one.
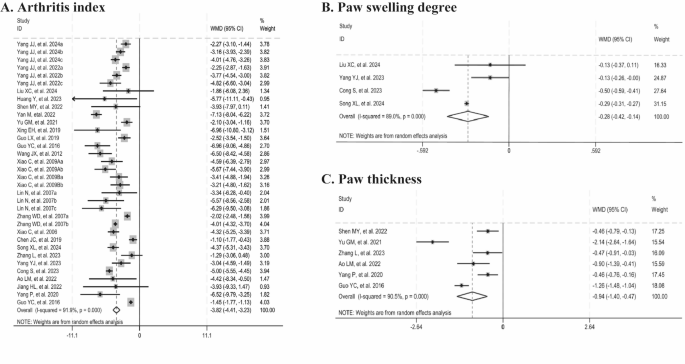
Forest plots summarizing the effects of Tripterygium wilfordii extracts on joint manifestations compared with the control group (A: arthritis index; B: paw swelling degree; C: paw thickness).
In addition, we further explored potential sources of heterogeneity through univariate meta-regression and subgroup analyses. The meta-regression analysis of AI identified animal species as the primary source of heterogeneity. Subgroup analysis indicated that, although the difference was not statistically significant, the 95% CI suggested a relatively more pronounced improvement in AI among mice. Moreover, subgroup analysis of paw thickness revealed that animal species and sex could be potential sources of heterogeneity. It was observed that heterogeneity was eliminated in the mice subgroup and in the male subgroup. The application in female animals showed a more pronounced improvement effect, whereas the application of TP did not show a significant improvement effect on paw thickness. However, both applications exhibited high heterogeneity (Tables 3 and 4).
Histopathological changes in joints
Eight studies showed that histopathological score was significantly reduced with Tripterygium wilfordii extracts (n = 140, WMD = -3.23, 95% CI: -4.13 to -2.34, p = 0.000; I2 = 95.4%, p = 0.000, Fig. 4A). Four studies documented cartilage damage (n = 76, WMD = -1.67, 95% CI: -2.18 to -1.17, p = 0.000; I2 = 79.3%, p = 0.000, Fig. 4B), three reported bone destruction (n = 58, WMD = -0.85, 95% CI: -1.57 to -0.13, p = 0.021; I2 = 95.9%, p = 0.000, Fig. 4C), seven observed synovial hyperplasia (n = 94, WMD = -0.87, 95% CI: -1.06 to -0.68, p = 0.000; I2 = 0%, p = 0.605, Fig. 4D), five noted pannus formation (n = 88, WMD = -0.82, 95% CI: -1.10 to -0.55, p = 0.000; I2 = 51.1%, p = 0.056, Fig. 4E), and seven reported inflammatory cell infiltration (n = 118, WMD = -1.39, 95% CI: -1.77 to -1.01, p = 0.000; I2 = 80.8%, p = 0.000, Fig. 4F). Collectively, these findings suggested that Tripterygium wilfordii extracts significantly ameliorate these pathological indices. Sensitivity analyses showed that the results were consistently stable when animal studies were excluded on a case-by-case basis, thus ensuring the robustness of the histopathological score, cartilage damage, and inflammatory cell infiltration results. After excluding the study by Ding ZH, et al. (2024), the heterogeneity for bone destruction was significantly reduced (I2 = 14%). Similarly, upon the exclusion of the study by Yang YJ, et al. (2023), no heterogeneity was observed in pannus formation (I2 = 0%). The improved results for these analyses remained consistent upon the exclusion of these studies.
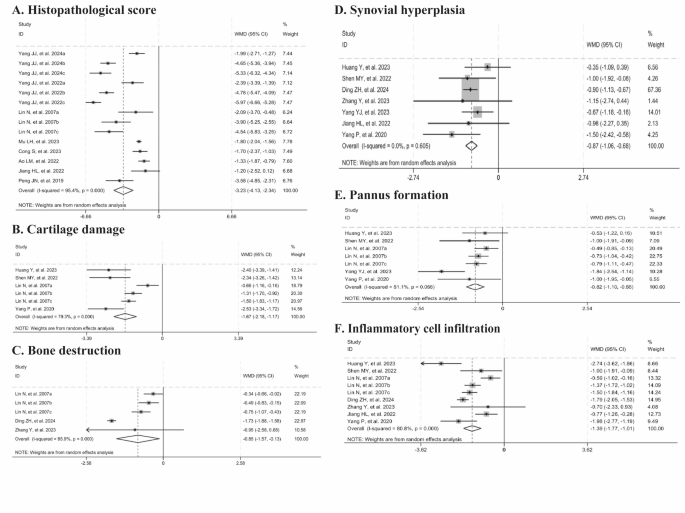
Forest plots summarizing the effects of Tripterygium wilfordii extracts on histopathological changes in joints compared with the control group (A: histopathological score; B: cartilage damage; C: bone destruction; D: synovial hyperplasia; E: pannus formation; F: inflammatory cell infiltration).
Considering the high heterogeneity of the above five indicators, we further employed meta-regression and subgroup analyses. Meta-regression analysis revealed that animal species and extract category were the primary sources of heterogeneity for histopathological score. 95% CI from subgroup analysis indicated that improvements in histopathological score were more pronounced with the use of mice compared to rats, showing a significant difference (95% CI not overlapping). Additionally, improvements in histopathological score were more pronounced with CEL and TP than with TG, with a significant difference for CEL (95% CI not overlapping). Subgroup analysis of pannus formation revealed that extract category, dosage, and treatment duration were major sources of heterogeneity. The results indicated that heterogeneity was eliminated in groups treated with TP, using high dosages, and with a treatment duration of less than or equal to one month. Meanwhile, the results showed that the improvement effect became insignificant when the treatment duration exceeded one month, exhibiting a high degree of heterogeneity in this subgroup. Subgroup analysis of bone destruction also showed that extract category, dosage, and treatment duration were important sources of heterogeneity. The results indicated that heterogeneity was eliminated in groups where TG was applied, low dosages were selected, and the treatment duration was more than one month. The 95% CI suggested that the improvement effect was significantly stronger in the group applying TG, and with a treatment duration of more than one month compared to the group applying TP, and with a treatment duration of less than or equal to one month (95% CI not overlapping) (Tables 3 and 5).
Secondary outcome measures
Cytokines and antibody changes
-
(1)
Cytokines related to the activation and differentiation of innate immune cells.
These cytokines are mainly secreted by innate immune cells, including pro-inflammatory cytokines such as TNF-α, IL-1β, IL-6, and IL-23, as well as anti-inflammatory cytokines like IL-1056. The levels of TNF-α were reported in eighteen studies, IL-1β in eleven, IL-6 in twelve, IL-23 in three, and IL-10 in ten studies. The meta-analysis results demonstrated significant reductions in TNF-α (n = 274, SMD = -3.36, 95% CI: -4.17 to -2.56, p = 0.000; I2 = 80.9%, p = 0.000, Fig. 5A), IL-1β (n = 158, SMD = -3.77, 95% CI: -4.84 to -2.69, p = 0.000; I2 = 79.1%, p = 0.000, Fig. 5B), IL-6 (n = 176, SMD = -2.40, 95% CI: -3.24 to -1.55, p = 0.000; I2 = 72.7%, p = 0.000, Fig. 5C), and IL-23 (n = 42, SMD = -1.92, 95% CI: -3.24 to -0.60, p = 0.004; I2 = 58.9%, p = 0.088, Fig. 5D) levels in the groups treated with Tripterygium wilfordii extracts compared to the control groups. Conversely, upregulated changes in IL-10 levels (n = 164, SMD = 2.89, 95% CI: 1.62 to 4.15, p = 0.000; I2 = 87.3%, p = 0.000, Fig. 5E) induced by Tripterygium wilfordii extracts were observed in ten studies. Due to the observed heterogeneity in these cytokines, sensitivity analyses were performed, and the findings demonstrated that the results remained stable when individual studies were sequentially excluded for TNF-α, IL-1β, and IL-10. Meanwhile, we discovered that excluding the study by Song XL, et al. (2023) reduced IL-6 heterogeneity to 47%, and the significant improvement persisted (p < 0.00001). Similarly, omitting the study by Shen MY, et al. (2022) markedly decreased IL-23 heterogeneity to 0%, with the significant improvement also remaining (p < 0.0001).

Forest plots summarizing the effects of Tripterygium wilfordii extracts on cytokines and antibody changes compared with the control group (A: TNF-α; B: IL-1β; C: IL-6; D: IL-23; E: IL-10; F: IL-2; G: IFN-γ; H: IL-4; I: IL-17; J: TGF-β; K: anti-type II collagen antibodies).
To further explore the sources of heterogeneity, meta-regression and subgroup analyses were conducted. For IL-1β, meta-regression analysis revealed that animal species and extract category may be the primary sources of heterogeneity. The results indicated that the improvements in IL-1β levels were more pronounced when using mice and applying CEL, showing a significant difference (95% CI not overlapping). Meta-regression analysis for TNF-α also identified that extract category may be the main source of heterogeneity. Improvements in TNF-α levels were more pronounced when CEL or TP were applied compared to TG, with a significant difference for CEL (95% CI not overlapping). For IL-10, meta-regression and subgroup analyses found that extract dosage and treatment duration could be the primary sources of heterogeneity. The results revealed that improvements in IL-10 levels were more pronounced with low dosages and treatment durations exceeding one month, showing a significant difference (95% CI not overlapping). In contrast, high dosages did not significantly improve IL-10 levels (Tables 6 and 7).
-
(2)
Cytokines related to the activation and differentiation of adaptive immune T cells.
These cytokines are mainly secreted by adaptive immune T cells. IL-2 is a cytokine related to the activation of CD4 and CD8 cells56. Changes in IL-2 levels were assessed in four studies. The meta-analysis indicated that the effect of Tripterygium wilfordii extracts on IL-2 levels was not statistically significant (n = 56, SMD = -2.11, 95% CI: -4.72 to 0.49, p = 0.112; I2 = 90.9%, p = 0.000, Fig. 5F). IFN-γ is a cytokine associated with Th1 differentiation. Four studies evaluated changes in IFN-γ levels. The meta-analysis results demonstrated that Tripterygium wilfordii extracts significantly downregulated the expression levels of IFN-γ (n = 68, SMD = -1.86, 95% CI: -2.98 to -0.74, p = 0.001; I2 = 67.4%, p = 0.015, Fig. 5G). IL-4 is a cytokine associated with Th2 differentiation. Changes in IL-4 levels were assessed in four studies. The meta-analysis indicated that IL-4 levels (n = 62, SMD = 1.15, 95% CI: 0.54 to 1.76, p = 0.000; I2 = 0%, p = 0.691, Fig. 5H) were significantly upregulated in the groups treated with Tripterygium wilfordii extracts. IL-17 is a cytokine associated with Th17 differentiation. IL-17 levels were reported in five studies and the meta-analysis results demonstrated significant reductions in IL-17 levels (n = 74, SMD = -2.29, 95% CI: -3.03 to -1.56, p = 0.000; I2 = 46.6%, p = 0.112, Fig. 5I) in the groups treated with Tripterygium wilfordii extracts. TGF-β is a cytokine associated with Treg differentiation. Upregulated changes in TGF-β levels (n = 70, SMD = 1.98, 95% CI: 0.83 to 3.14, p = 0.001; I2 = 77.0%, p = 0.002, Fig. 5J) induced by Tripterygium wilfordii extracts were observed and reported in four studies. Due to the observed heterogeneity in the above indicators, sensitivity analyses were conducted. The findings demonstrated that when the study by Mu LH, et al. (2023) was excluded, the heterogeneity of IFN-γ was reduced to 33%, and the results continued to show a significant decrease (p < 0.0001). Additionally, when each study was sequentially excluded from the analysis, the results of the remaining indicators remained stable.
Meanwhile, considering the heterogeneity observed in multiple indicators mentioned above, we further performed subgroup analyses. The subgroup analyses of IFN-γ levels indicated that extract category and dosage might be the main sources of its heterogeneity. The results found that the application of TP, low dosage had a significant effect, while the application of TG, high dosage did not improve significantly (p > 0.05). Subgroup analyses of IL-17 levels suggested that animal species, extract category, and dosage may be the main sources of heterogeneity. Heterogeneity was eliminated in groups treated with TG, using low dosages, and in mice. Although the 95% CI indicated that administration of TG, selection of the low dosage, and application to mice had a slightly better effect compared to administration of TP, selection of the high dosage, and application to rats, this difference was not statistically significant. Additionally, subgroup analyses indicated that animal species may be the main source of TGF-β heterogeneity. The 95% CI showed a significant difference, with more pronounced improvement observed in rats compared to mice (95% CI not overlapping) (Table 8).
-
(3)
Antibodies related to the activation of adaptive immune B cells.
Anti-type II collagen antibodies. These antibodies are primarily secreted by adaptive immune B cells. Four studies reduced anti-type II collagen antibodies with Tripterygium wilfordii extracts compared with controls (n = 54, SMD = -4.27, 95% CI: -6.88 to -1.66, p = 0.001; I2 = 89.5%, p = 0.000, Fig. 5K). Sensitivity analyses demonstrated that the results were stable when each study was sequentially excluded from the analysis of anti-type II collagen antibodies. Subgroup analyses revealed that the use of rats and low dosages had significant effects, while the use of mice and high dosages did not show significant improvements (p > 0.05) (Table 9).
Changes in T-cell subsets
-
(1)
Changes in the ratio of CD4+ and CD8+ T cells.
Three studies reported the percentage of CD4+ and CD8+ T cells. The meta-analysis revealed that the intervention with Tripterygium wilfordii extracts significantly reduced the percentage of CD4+ T cells (n = 50, SMD = -1.49, 95% CI: -2.21 to -0.77, p = 0.000; I2 = 38.6%, p = 0.180, Fig. 6A), whereas no statistically significant difference was observed in the percentage of CD8+ T cells (n = 50, SMD = 0.32, 95% CI: -0.94 to 1.58, p = 0.616; I2 = 81.8%, p = 0.001, Fig. 6B), compared to controls.
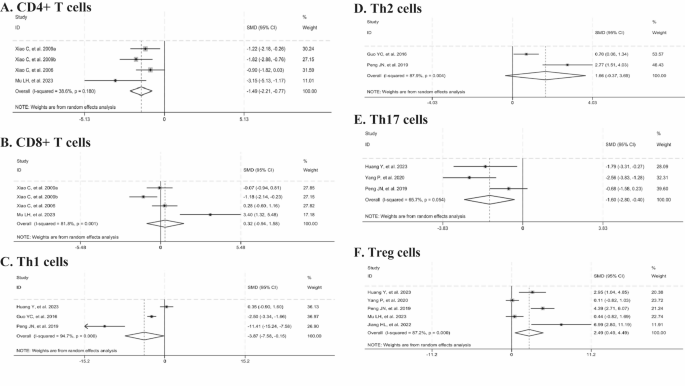
Forest plots summarizing the effects of Tripterygium wilfordii extracts on changes in T-cell subsets compared with the control group (A: CD4+ T cells; B: CD8+ T cells; C: Th1 cells; D: Th2 cells; E: Th17 cells; F: Treg cells).
-
(2)
Changes in the proportions of different subsets of CD4+ T cells.
Three studies documented the percentage of Th1 cells, two reported on Th2 cells, three on Th17 cells, and five on Treg cells. Compared with the control group, Tripterygium wilfordii extracts significantly reduced the levels of Th1 cells (n = 70, SMD = -3.87, 95% CI:-7.58 to -0.15, p = 0.041; I2 = 94.7%, p = 0.000, Fig. 6C) and Th17 cells (n = 48, SMD =-1.60, 95% CI: -2.80 to -0.40, p = 0.009; I2 = 65.7%, p = 0.054, Fig. 6E). In contrast, they significantly elevated the level of Treg cells (n = 66, SMD = 2.49, 95% CI: 0.49 to 4.49, p = 0.015; I2 = 87.2%, p = 0.000, Fig. 6F), whereas no significant difference was observed in Th2 cells (n = 60, SMD = 1.66, 95%CI:-0.37 to 3.69, p = 0.109; I2 = 87.9%, p = 0.004, Fig. 6D). Given the observed heterogeneity, sensitivity analyses were conducted. The results demonstrated that the findings remained stable when individual studies were sequentially excluded from the analyses of Th1 and Treg cells. Upon excluding the study by Peng, JN, et al. (2019), heterogeneity was no longer observed (I2 = 0%), and the statistically significant effect on Th17 cells persisted (p < 0.0001). Subgroup analyses revealed that animal species and treatment duration were the dominant factors contributing to heterogeneity in Treg cells. The results indicated that the use of rats and a treatment duration exceeding one month resulted in significant improvements in Treg levels. In contrast, the use of mice and a treatment duration of less than or equal to one month did not show significant improvements (p > 0.05) (Table 10).
Publication bias
We used the funnel plot and Egger’s test to explore the potential publication bias of AI, histopathological score, TNF-α, IL-6, IL-10, and IL-1β. The funnel plots displayed visual asymmetry, suggesting possible publication bias for these six outcome measures (Fig. S1). Subsequently, Egger’s test indicated evidence of publication bias for TNF-α, IL-6, IL-10, and IL-1β, but not for AI and histopathological score (Fig. S2). The consistency of results before and after the Trim-and-fill analysis demonstrated the stability of the pooled effect sizes for TNF-α, IL-6, IL-10, and IL-1β (Fig. S3 and Table S2).